
Exploring the dashboard
A tour of how the dashboard is laid out and the controls you'll use day to day: grouped queues, the collapsible sidebar, search, and the per-queue info panel.
Grouping queues by category
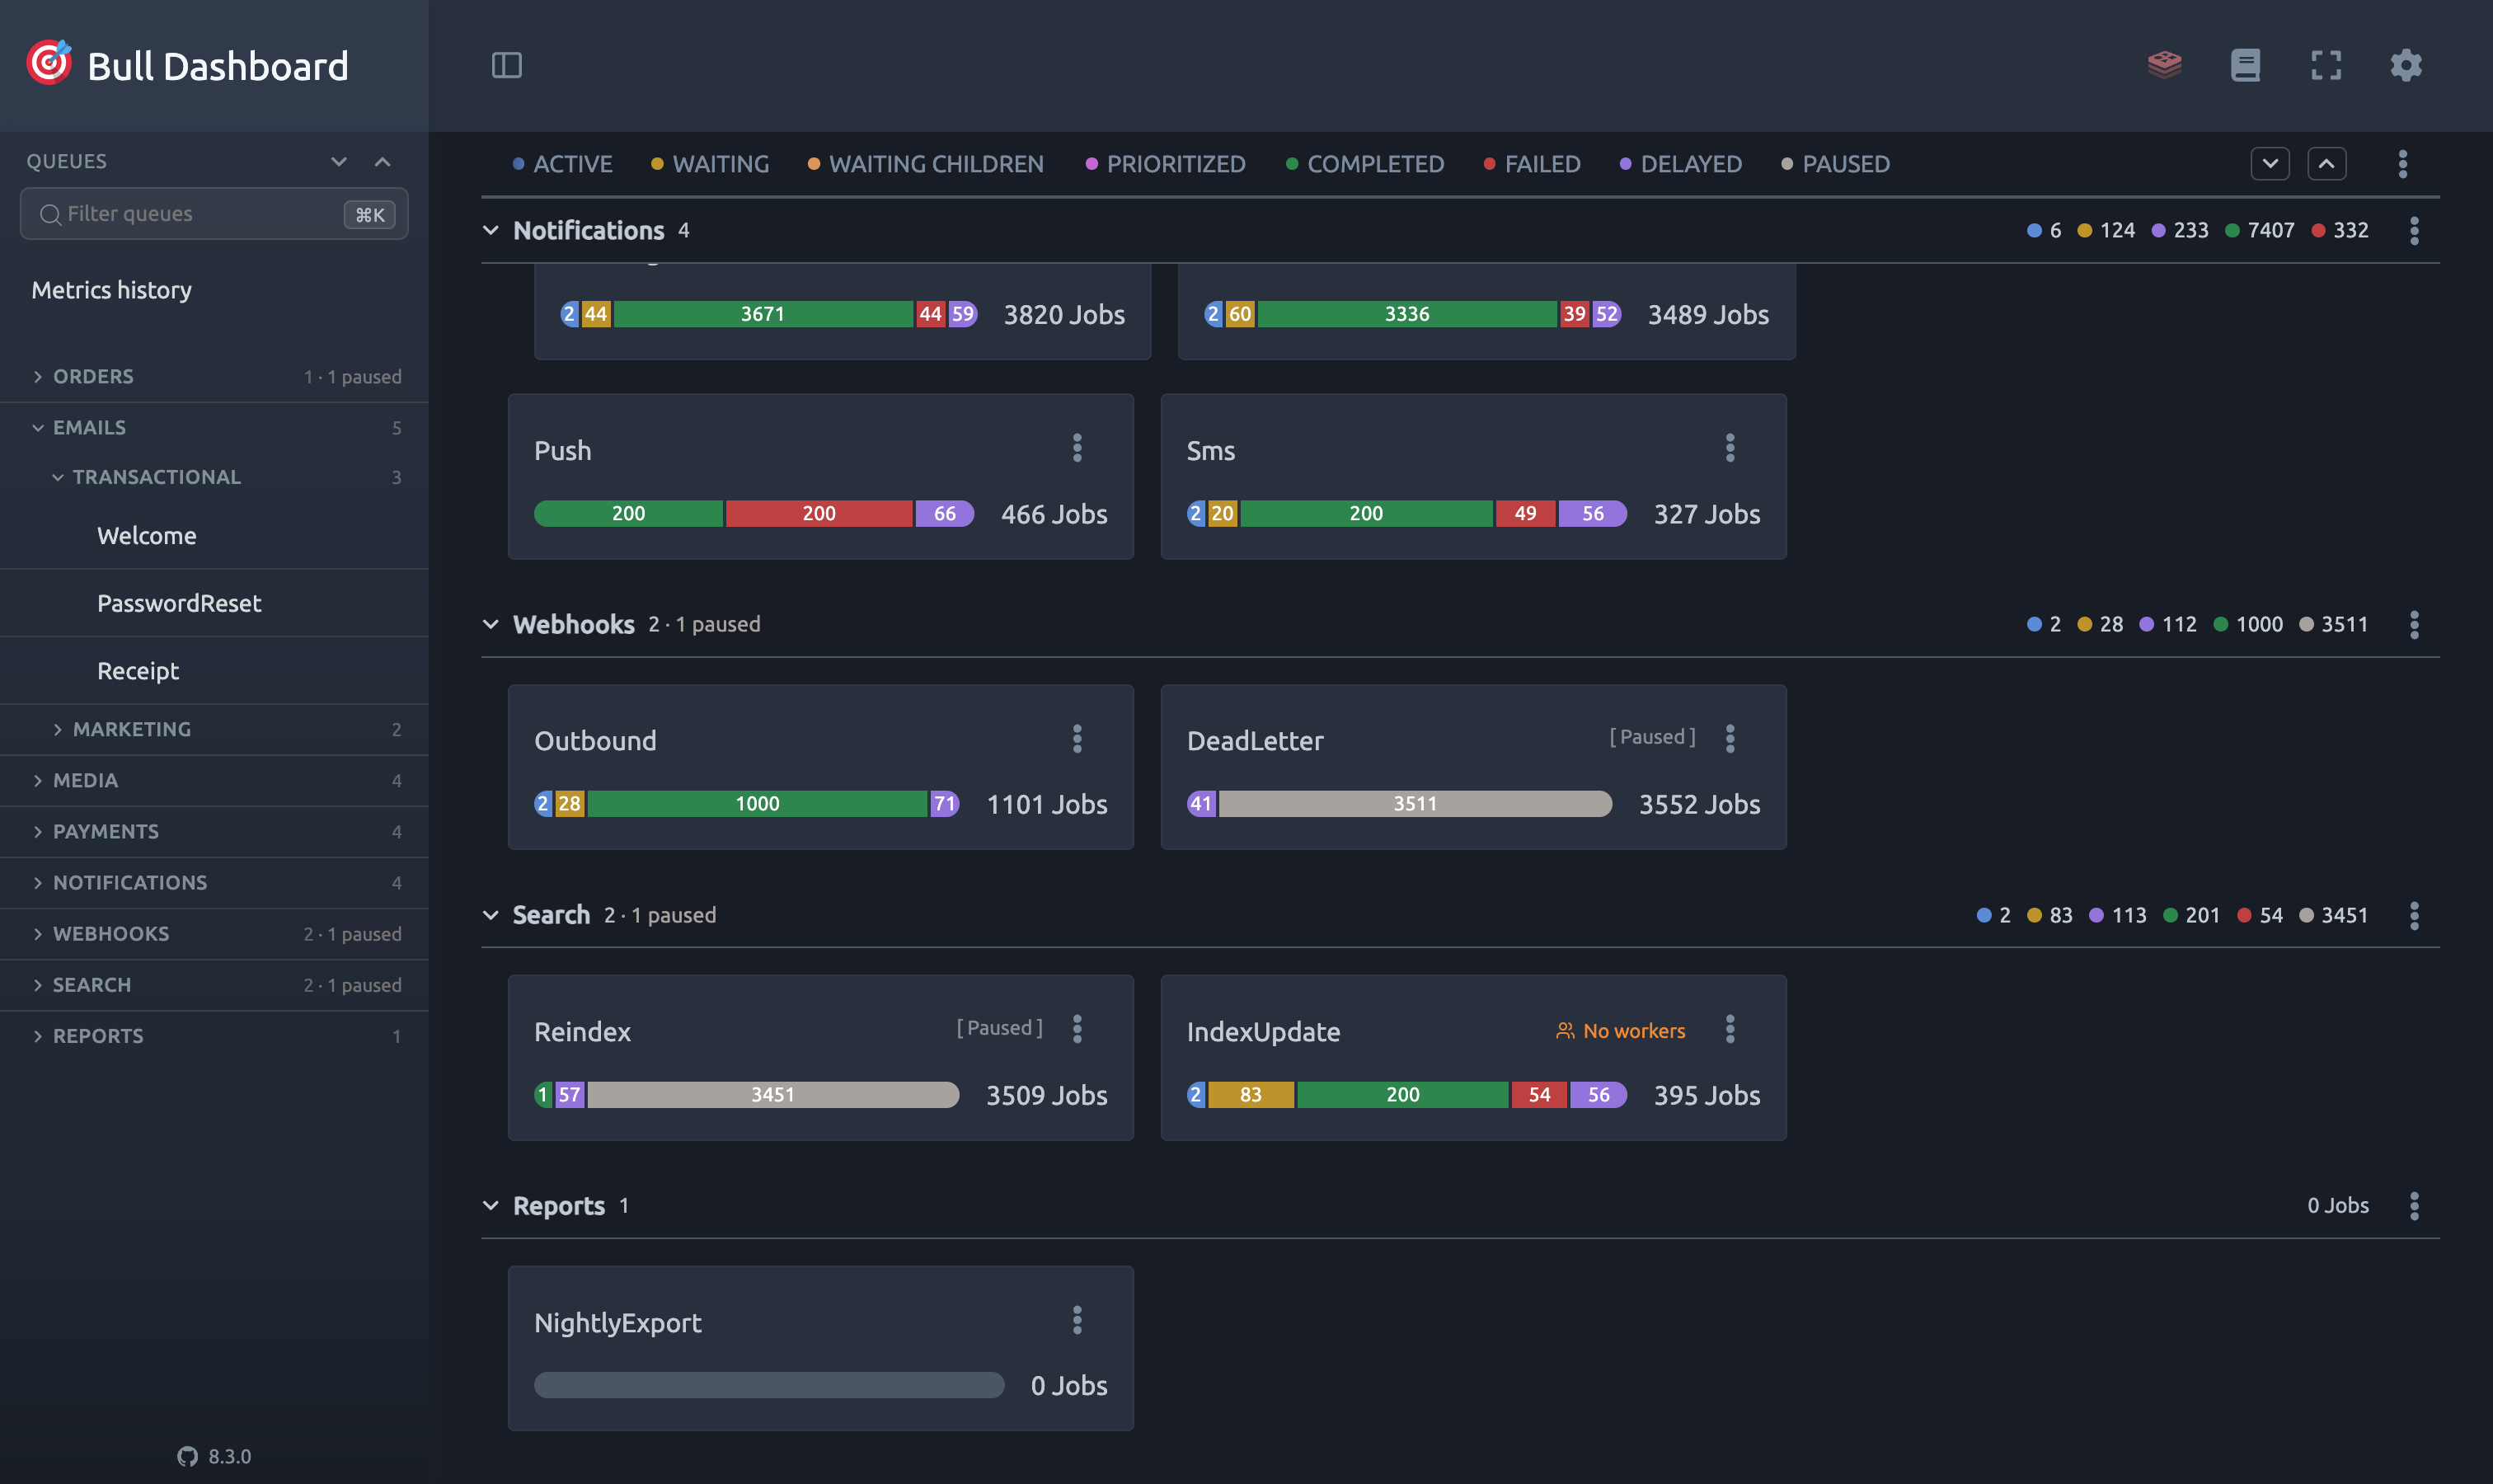
When a queue name contains a delimiter, bull-board splits it into a path. A queue named Emails.Transactional.Welcome registered with { delimiter: '.' } becomes Emails › Transactional › Welcome. The sidebar has always shown this as a tree; the main overview can now show the same structure.
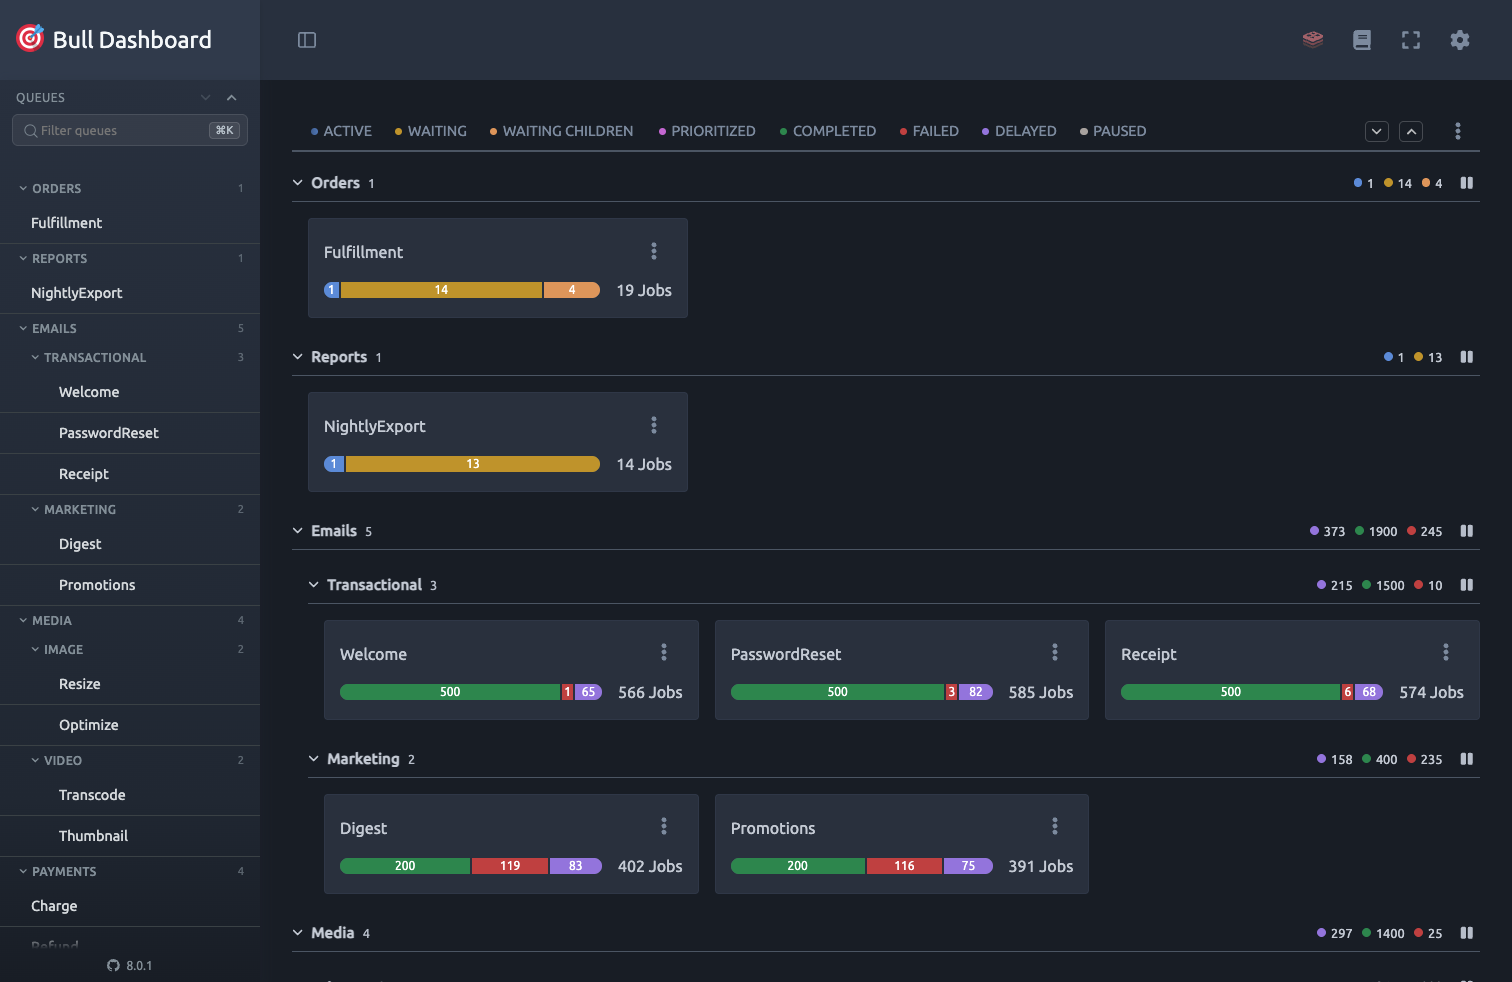
Each category header rolls up the job counts of every queue beneath it, so you can read the health of a whole domain, say all of Payments, without expanding it. Queues with no delimiter stay as plain cards.
Switch between the flat card grid and the grouped view from Settings → Queues → Group queues by category. Expand or collapse every section at once with the chevrons in the overview toolbar, and pause or resume a whole category from its header.
To make grouped the starting view for everyone, set it in UIConfig. This is only the default: once a user switches it in Settings, their choice is remembered and overrides the config on the next load.
Each view remembers which sections you collapsed, independently of the sidebar.
Collapsing the sidebar
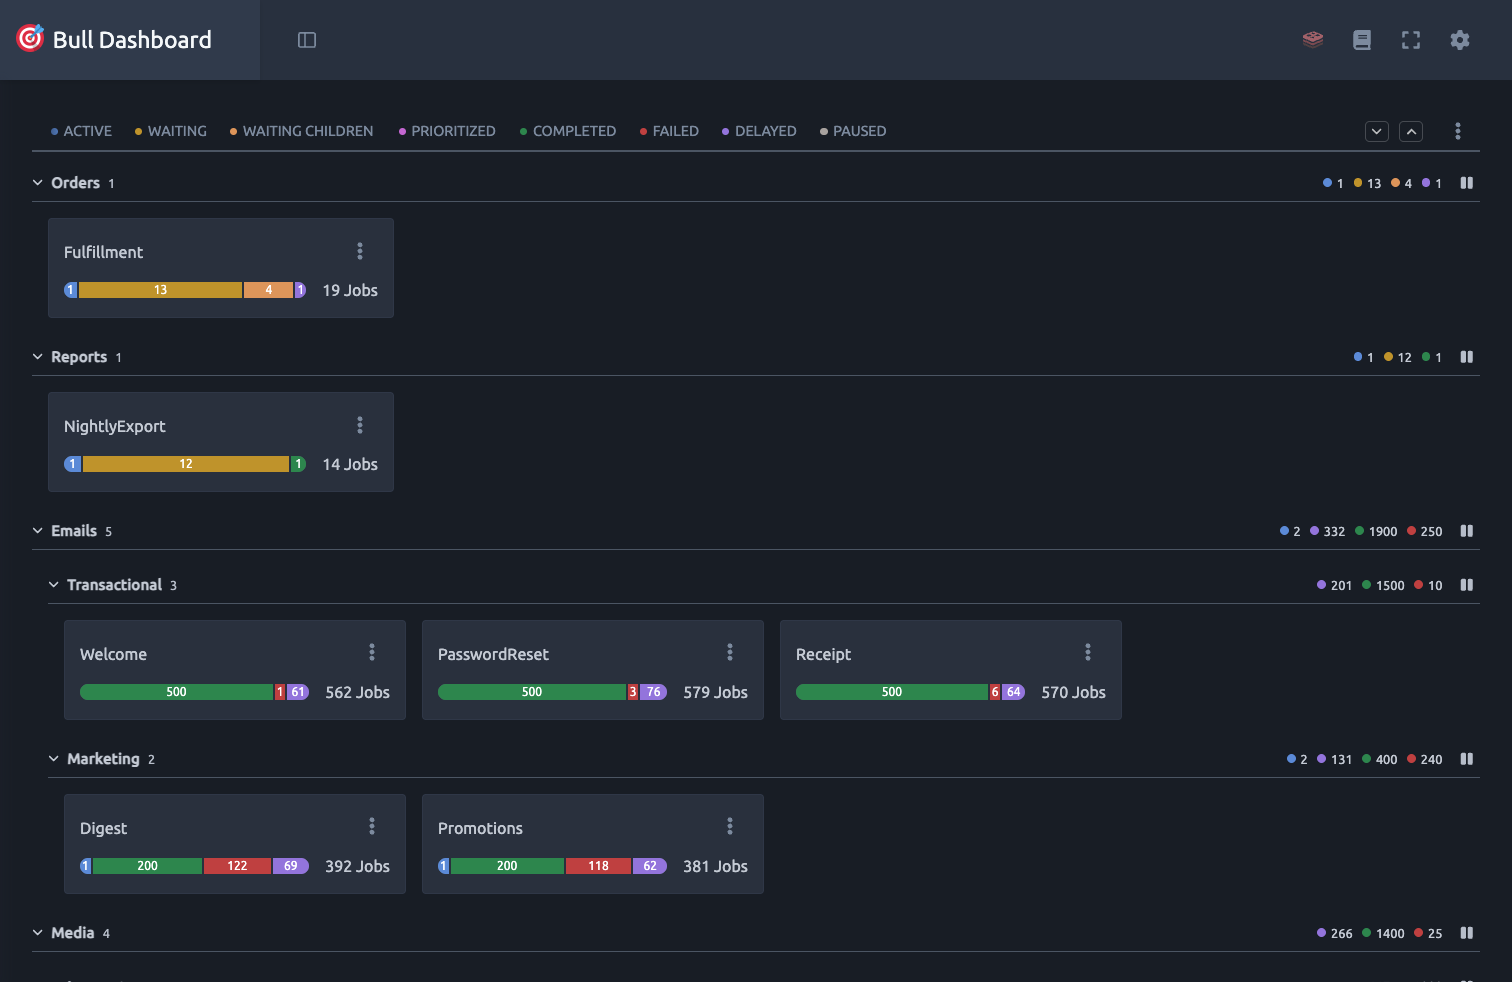
The toggle in the top-left of the header hides the sidebar and gives the content the full width, which helps on smaller screens or when you're working inside a single queue. The state is saved to your browser, so the dashboard reopens the way you left it.
Searching
The filter box at the top of the sidebar matches queues by name and drives both the sidebar tree and the overview at once. Press ⌘K (or Ctrl K) anywhere to jump straight to it. If the sidebar is collapsed, it opens first.
Filtering the overview by status
The row above the cards counts each status across the whole board. Click one and the overview drops to the queues holding jobs in that state, which is usually how you work out which queue the failures are actually in.
All is the first tab and the one you start on. It is also the way back out: the status sits in the URL as ?status=, so a filtered board is a link you can paste to someone, and All clears it.
The row scrolls rather than wraps once the statuses outrun the width. That happens on a narrow window, and in the grouped view, where the expand and collapse controls take the end of the row.
Schedulers
Queues that register job schedulers get a Schedulers entry in the sidebar. It lists every scheduler the board can see, across all queues, with its cron pattern or interval, when it fires next, when it last ran, and how many times it has run.
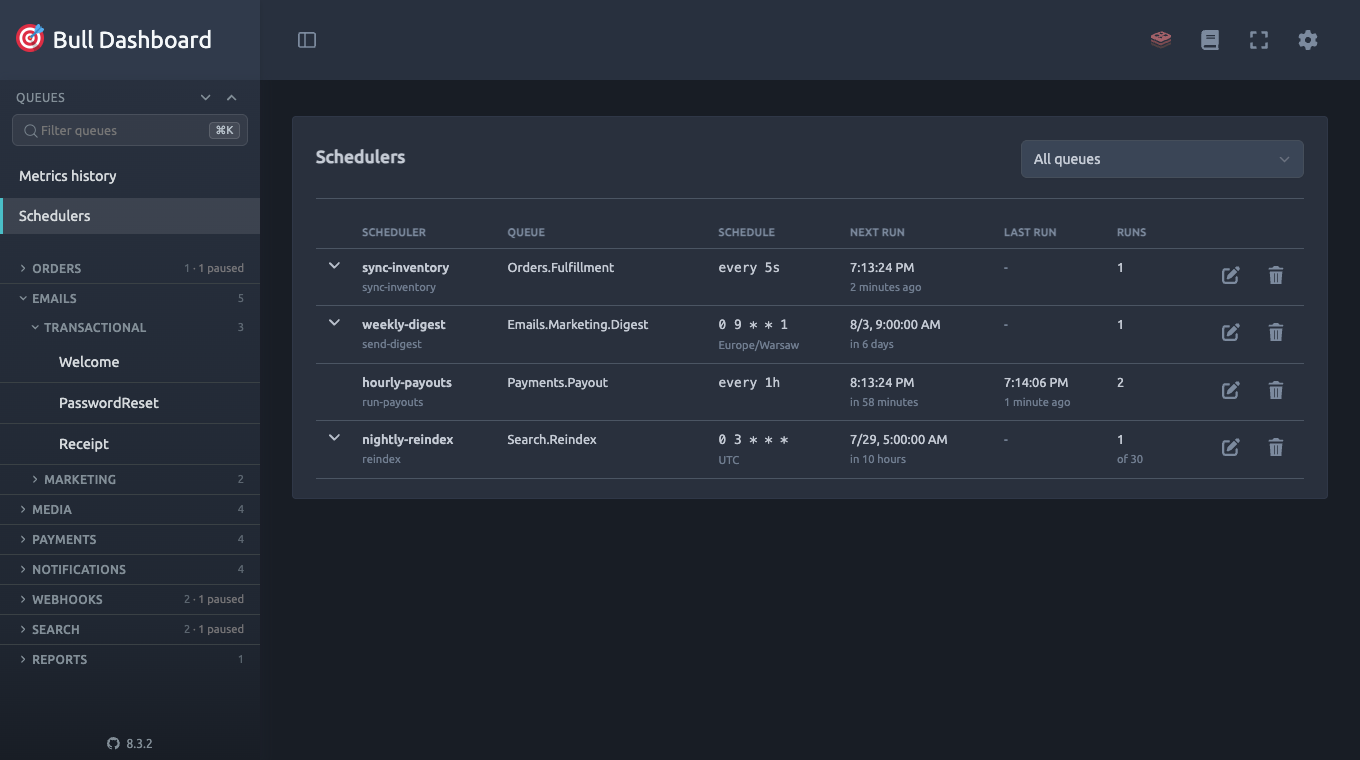
Last run is not something BullMQ stores. It is read from the pending run of each schedule, which the worker creates as the previous run starts, so a scheduler that has never fired leaves the column empty.
Both times link to the job behind them when there is one to open. The next run always links, since that job is sitting in the delayed set waiting to be picked up, which is also how you can inspect its payload or promote it. The last run links only when the job it produced still exists and the dashboard can name it, which means interval schedules whose previous run has not been trimmed away by removeOnComplete. Naming the previous run of a cron schedule would mean parsing the pattern backwards, so those show the time alone.
Each row can be removed, which stops the schedule and its pending run together, or edited to change the cron pattern, interval, time zone, run limit or end date. Editing only rewrites the schedule: the job the scheduler produces keeps the name, data and options your application registered. Both actions respect readOnlyMode, and editing is unavailable on legacy Bull queues, which have no way to update a repeatable job in place.
A row can also be run on demand. That adds one job built from the scheduler's template, with the same name, data and options, straight into the queue as an ordinary waiting job. The schedule itself is not touched: its pending run stays where it was and still fires at its own time, and the run counter does not move, because as far as BullMQ is concerned this is a job you added by hand rather than an iteration of the schedule. Use it to verify a fix without waiting for the next cron window. Running asks for confirmation first, respects readOnlyMode, and is unavailable on legacy Bull queues, which store no template to build the job from.
These are operational changes, not configuration
Most applications register their schedulers on start, and upsertJobScheduler overrides whatever is stored. So a schedule you edit here lasts until the next deploy or restart, at which point your application's own definition wins again, and a scheduler you remove comes back the same way. That makes the view a good place to stop a misbehaving cron or move it a few hours while you fix the job, and a poor place to make a change you expect to keep. Change the code for that.
The exception is a scheduler your application created dynamically and never re-registers, for a single tenant say. Nothing brings that one back, so removing it is permanent. bull-board cannot tell the two apart, which is why the confirmation says the runs stop until the application registers the scheduler again rather than promising either outcome.
Removing a scheduler takes its pending run with it. Completed and failed runs from the past stay where they are, and a run already being processed finishes normally.
Opening a queue that has schedulers shows a link into the same view, filtered to that queue.
Queue info
Open any queue and click the info icon next to its name.
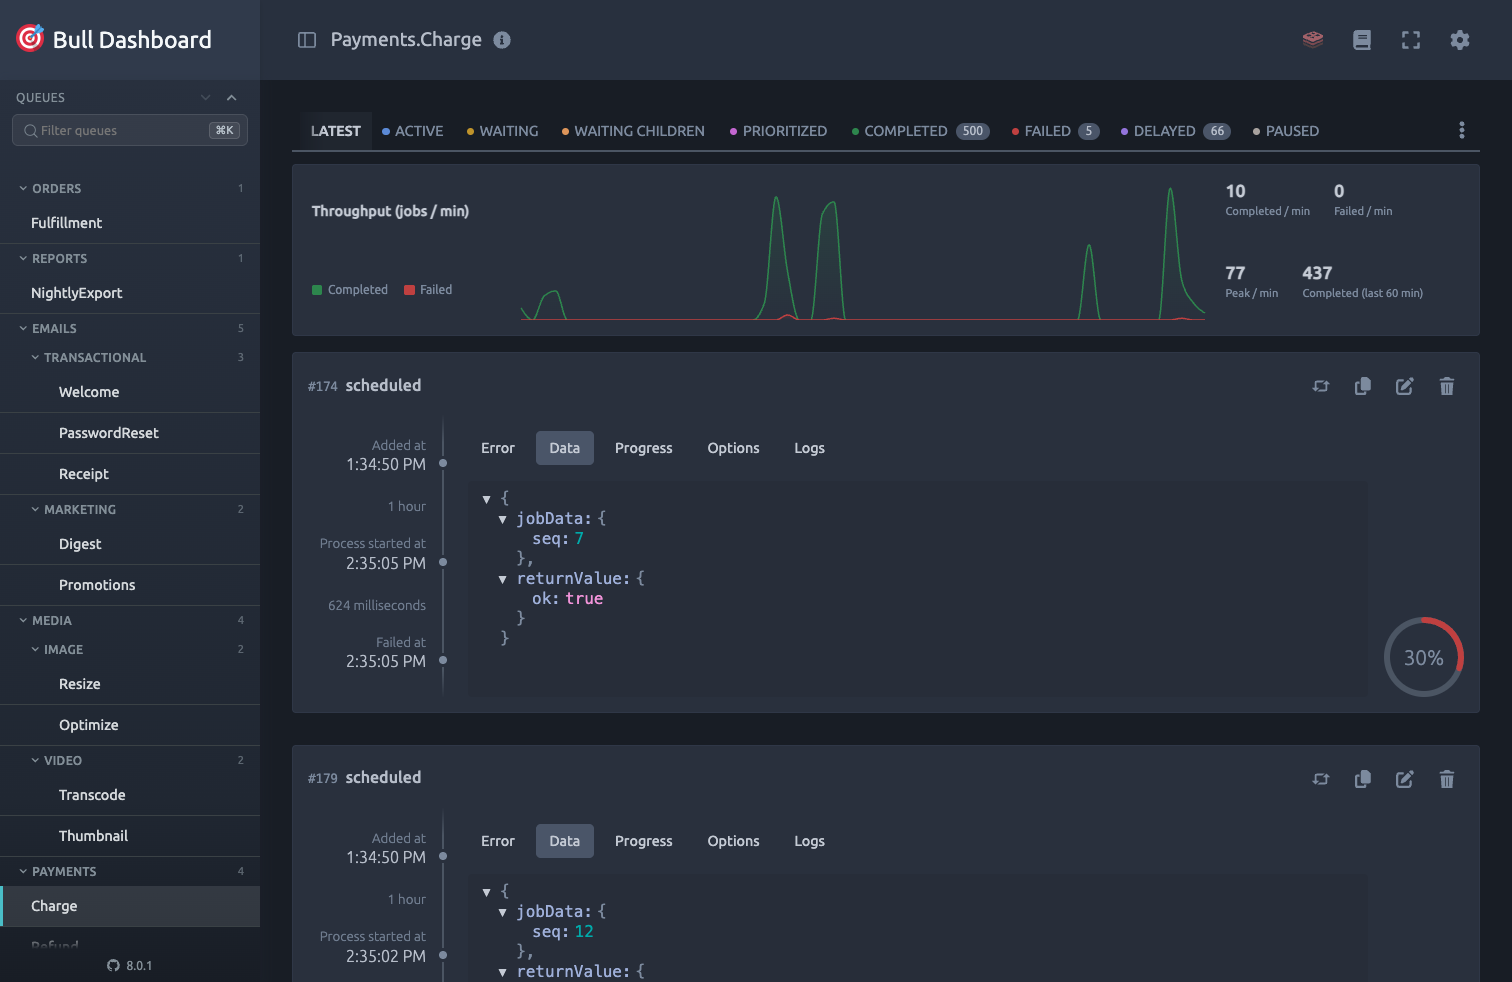
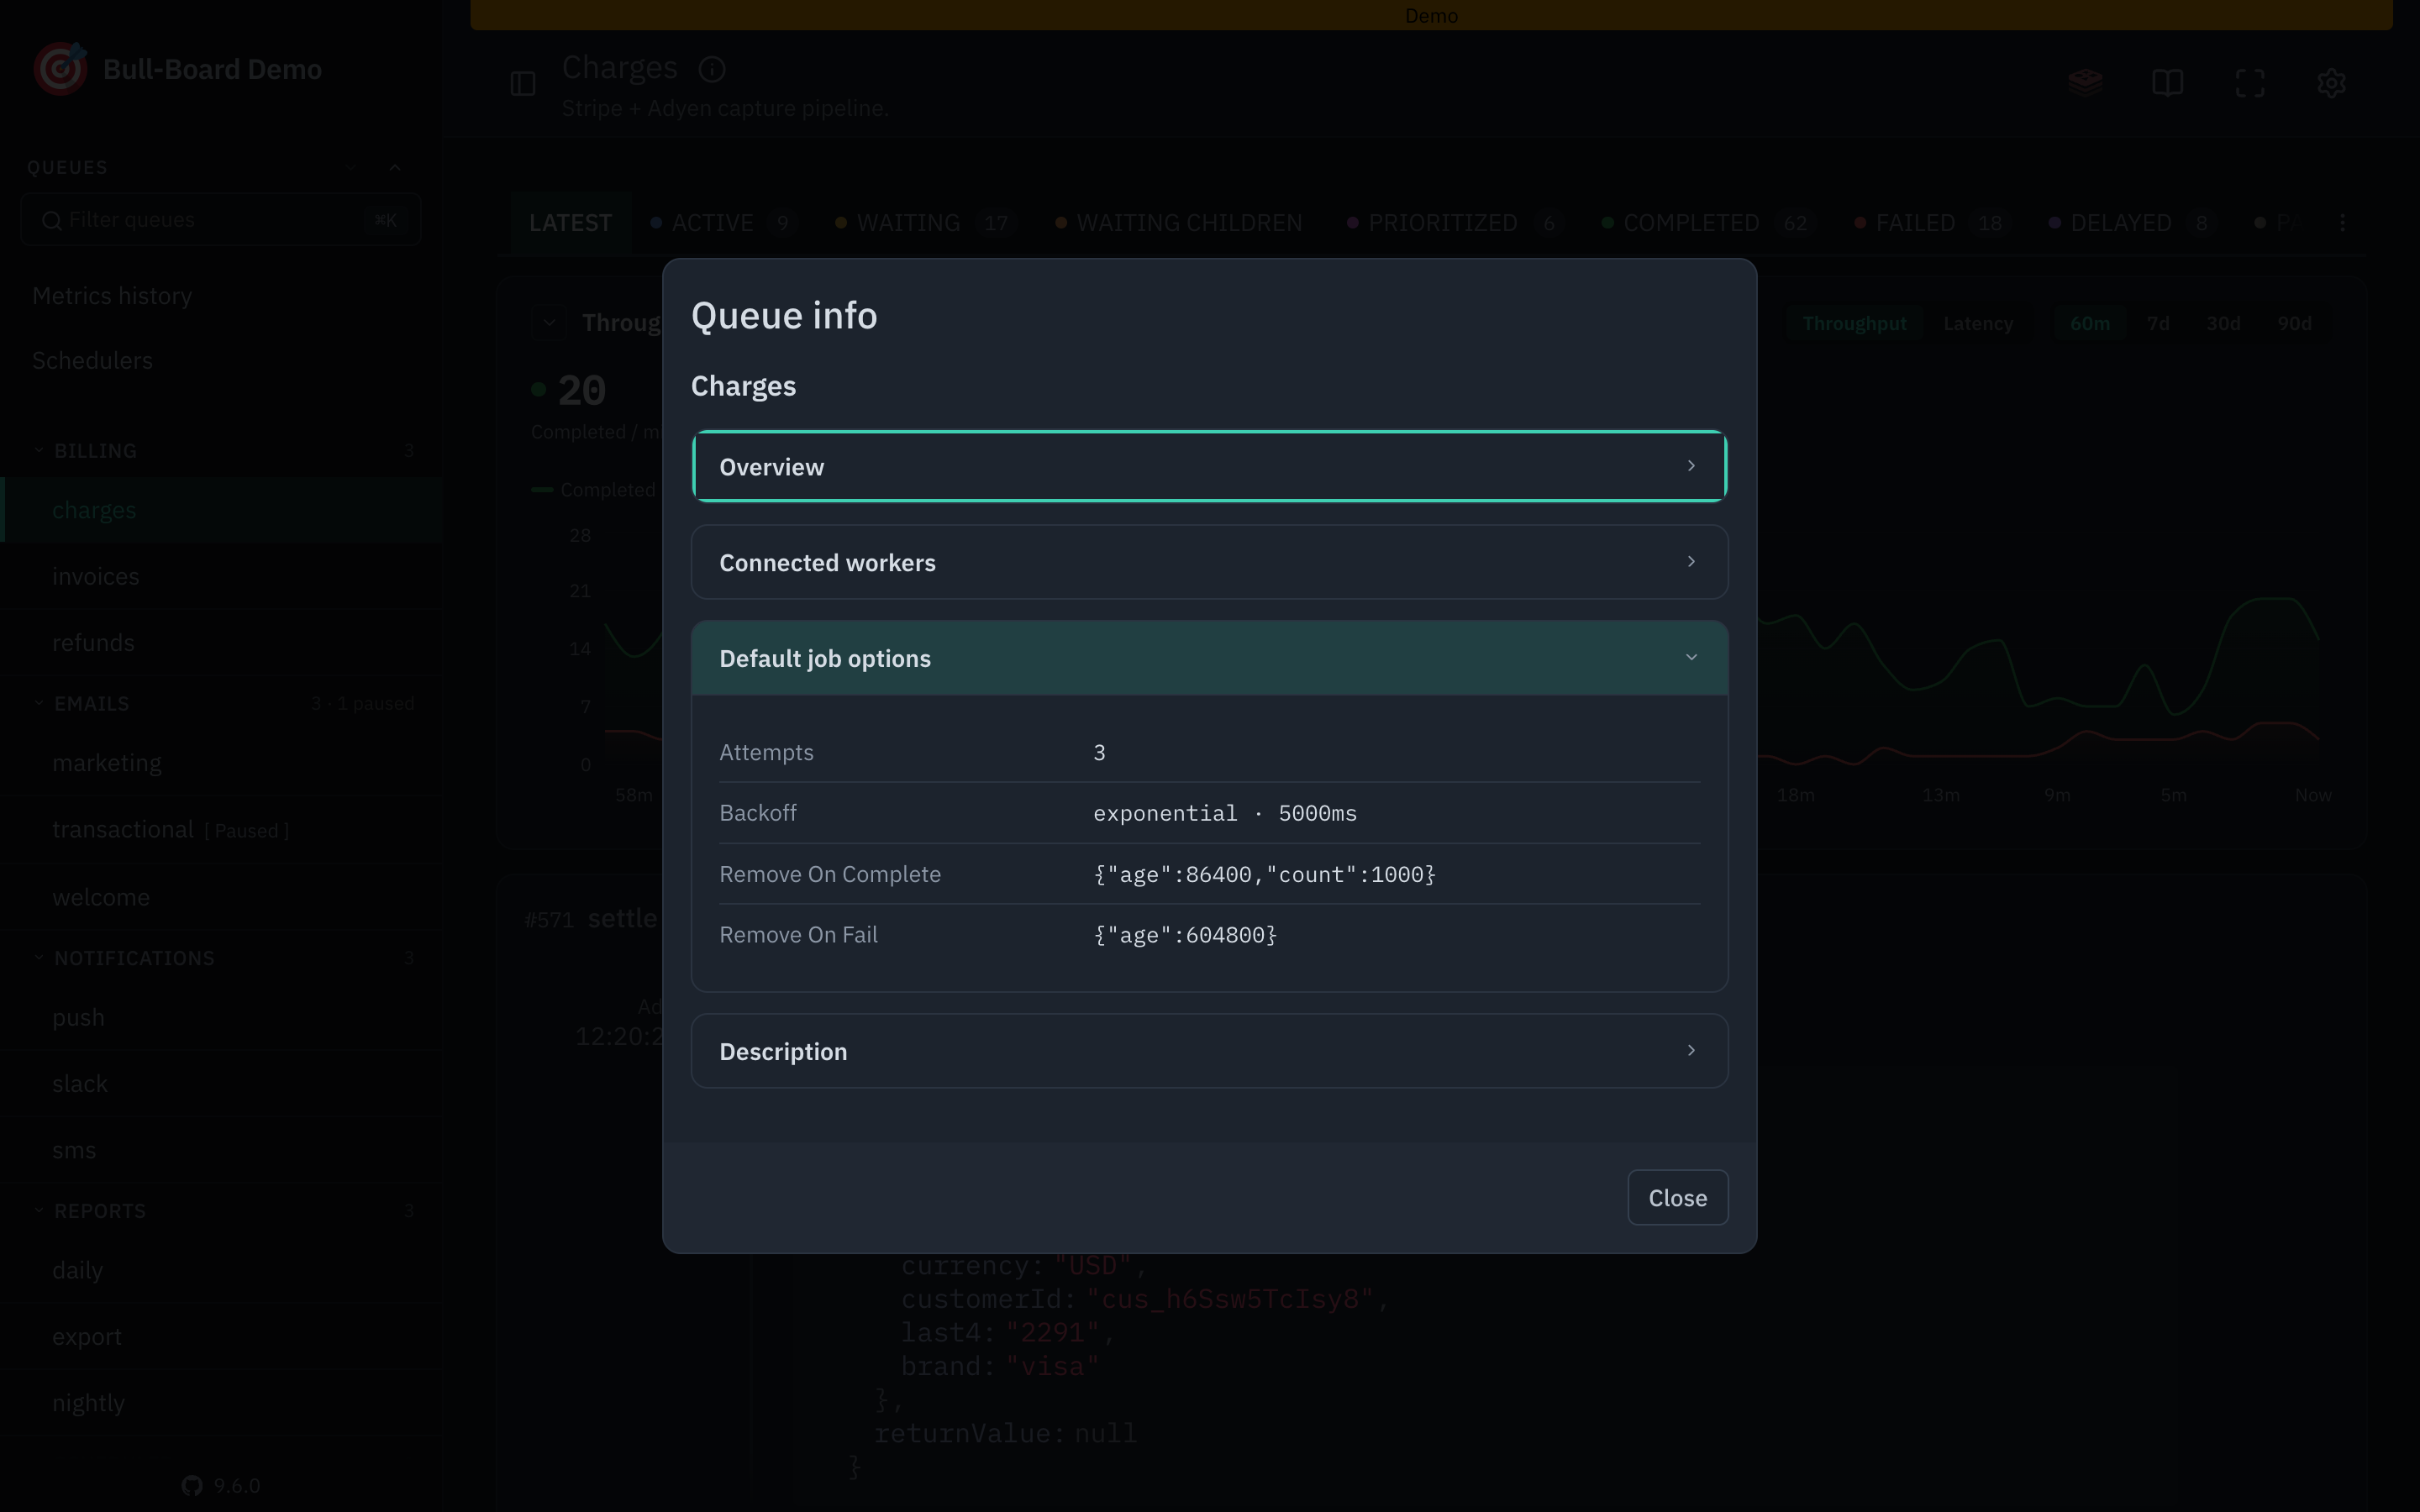
It opens a panel showing how the queue is configured: type, paused state, global concurrency, the configured rate limit, how many workers are connected, and the default job options (attempts, backoff, retention), so you don't have to dig through code.
Global concurrency and the rate limit are the two values the board can write, so those two rows have a pencil on them. The editor opens over the panel and puts you back on it when you close it, which saves reading a number on one screen and changing it on another. Neither pencil shows on a read-only queue, or on a Bull queue, which has no runtime setter for either. Both editors are in the queue's actions dropdown as well.
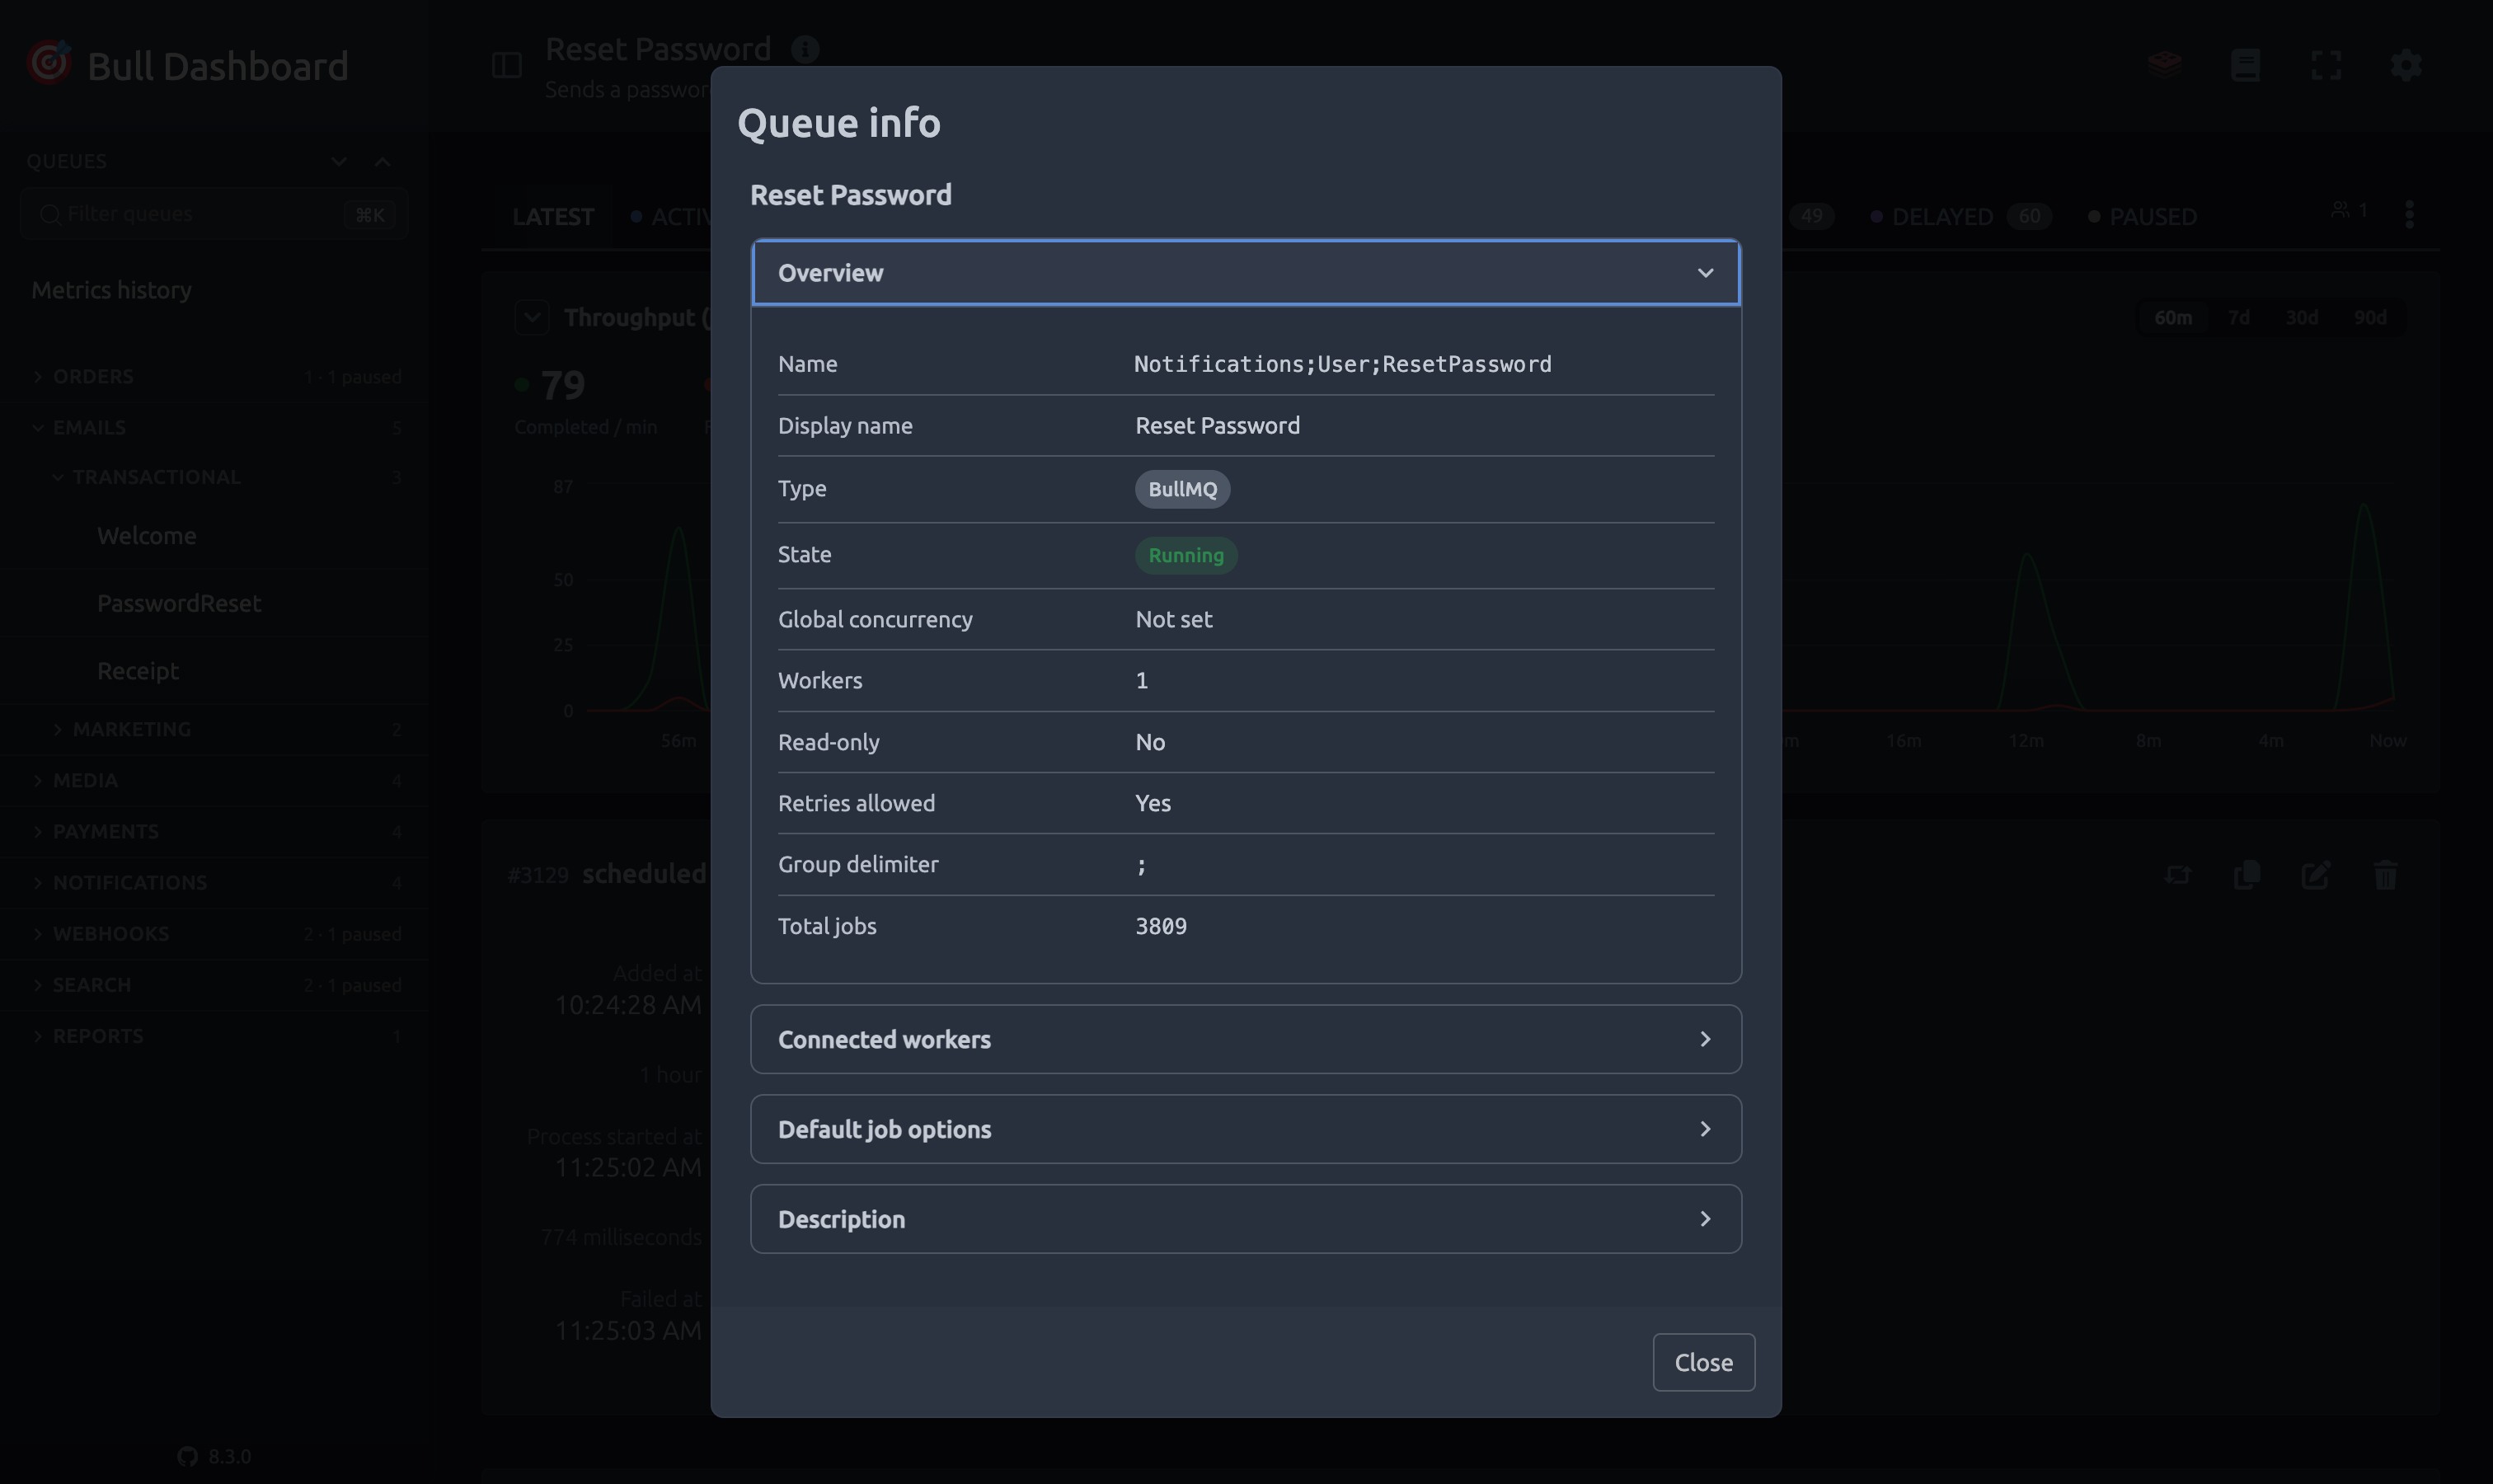
The default job options come from the queue itself, so what you see is what a job added now would inherit: attempts, backoff, and the retention that decides how long completed and failed jobs stick around.
Why a job is not moving
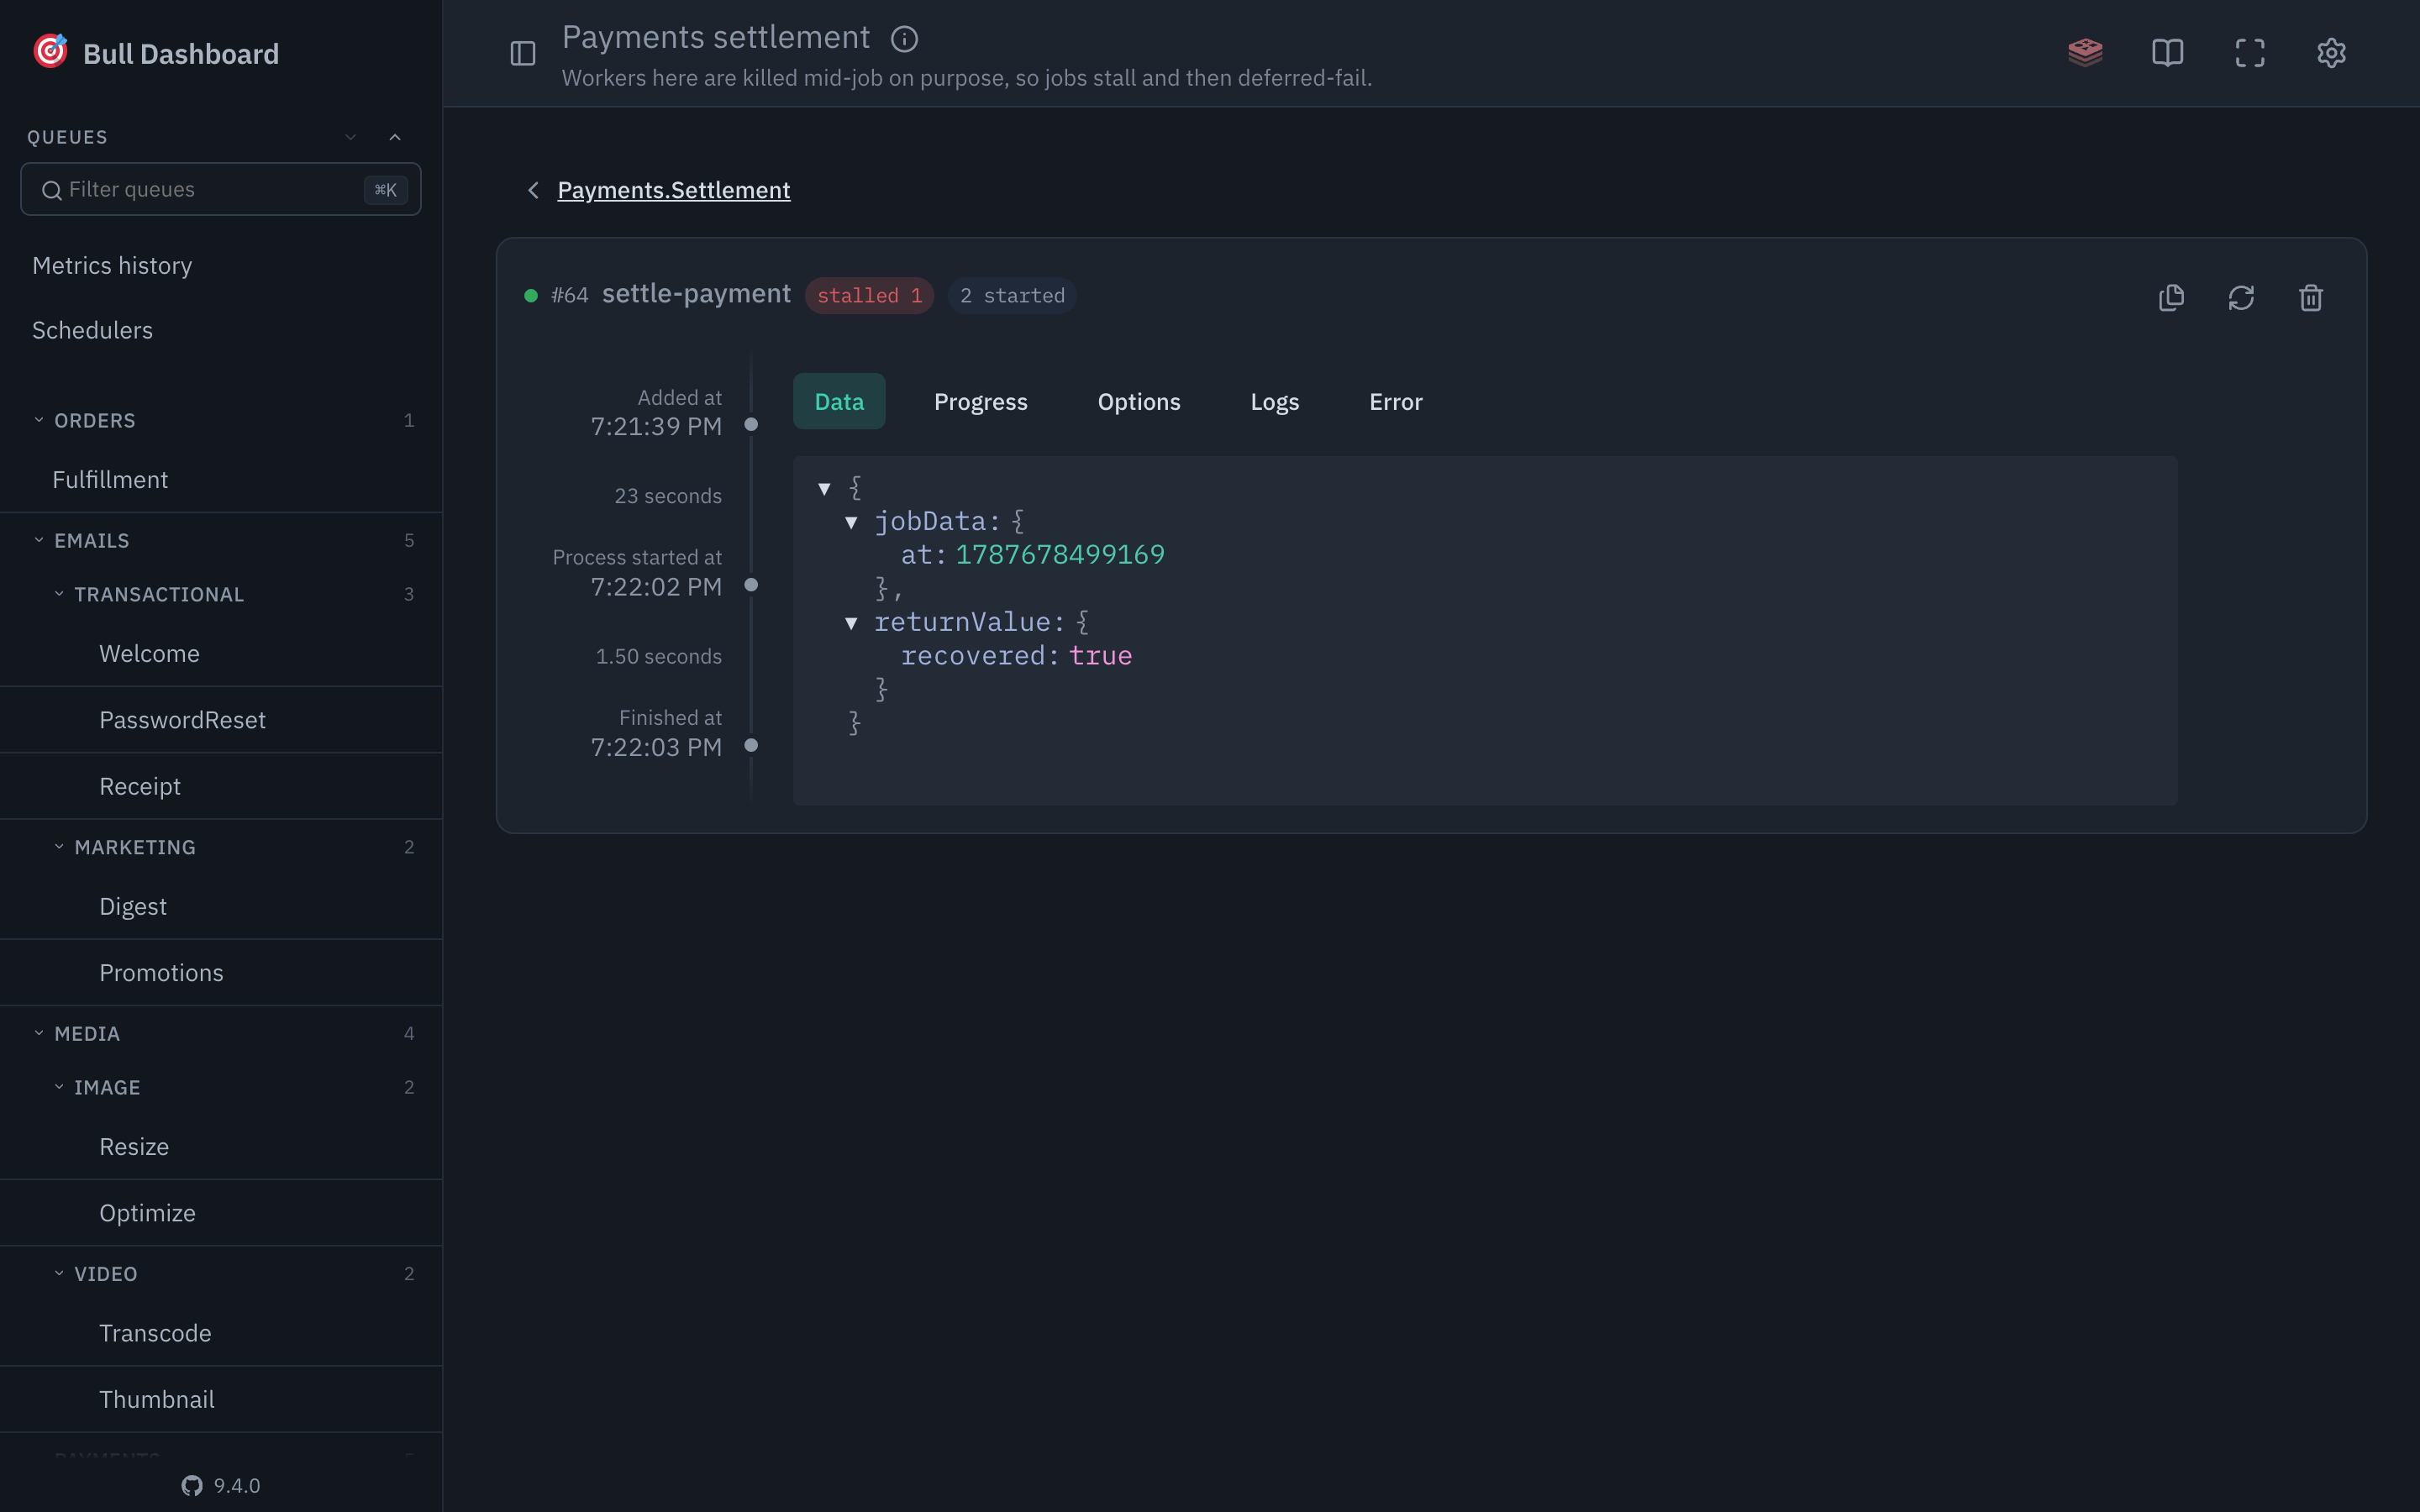
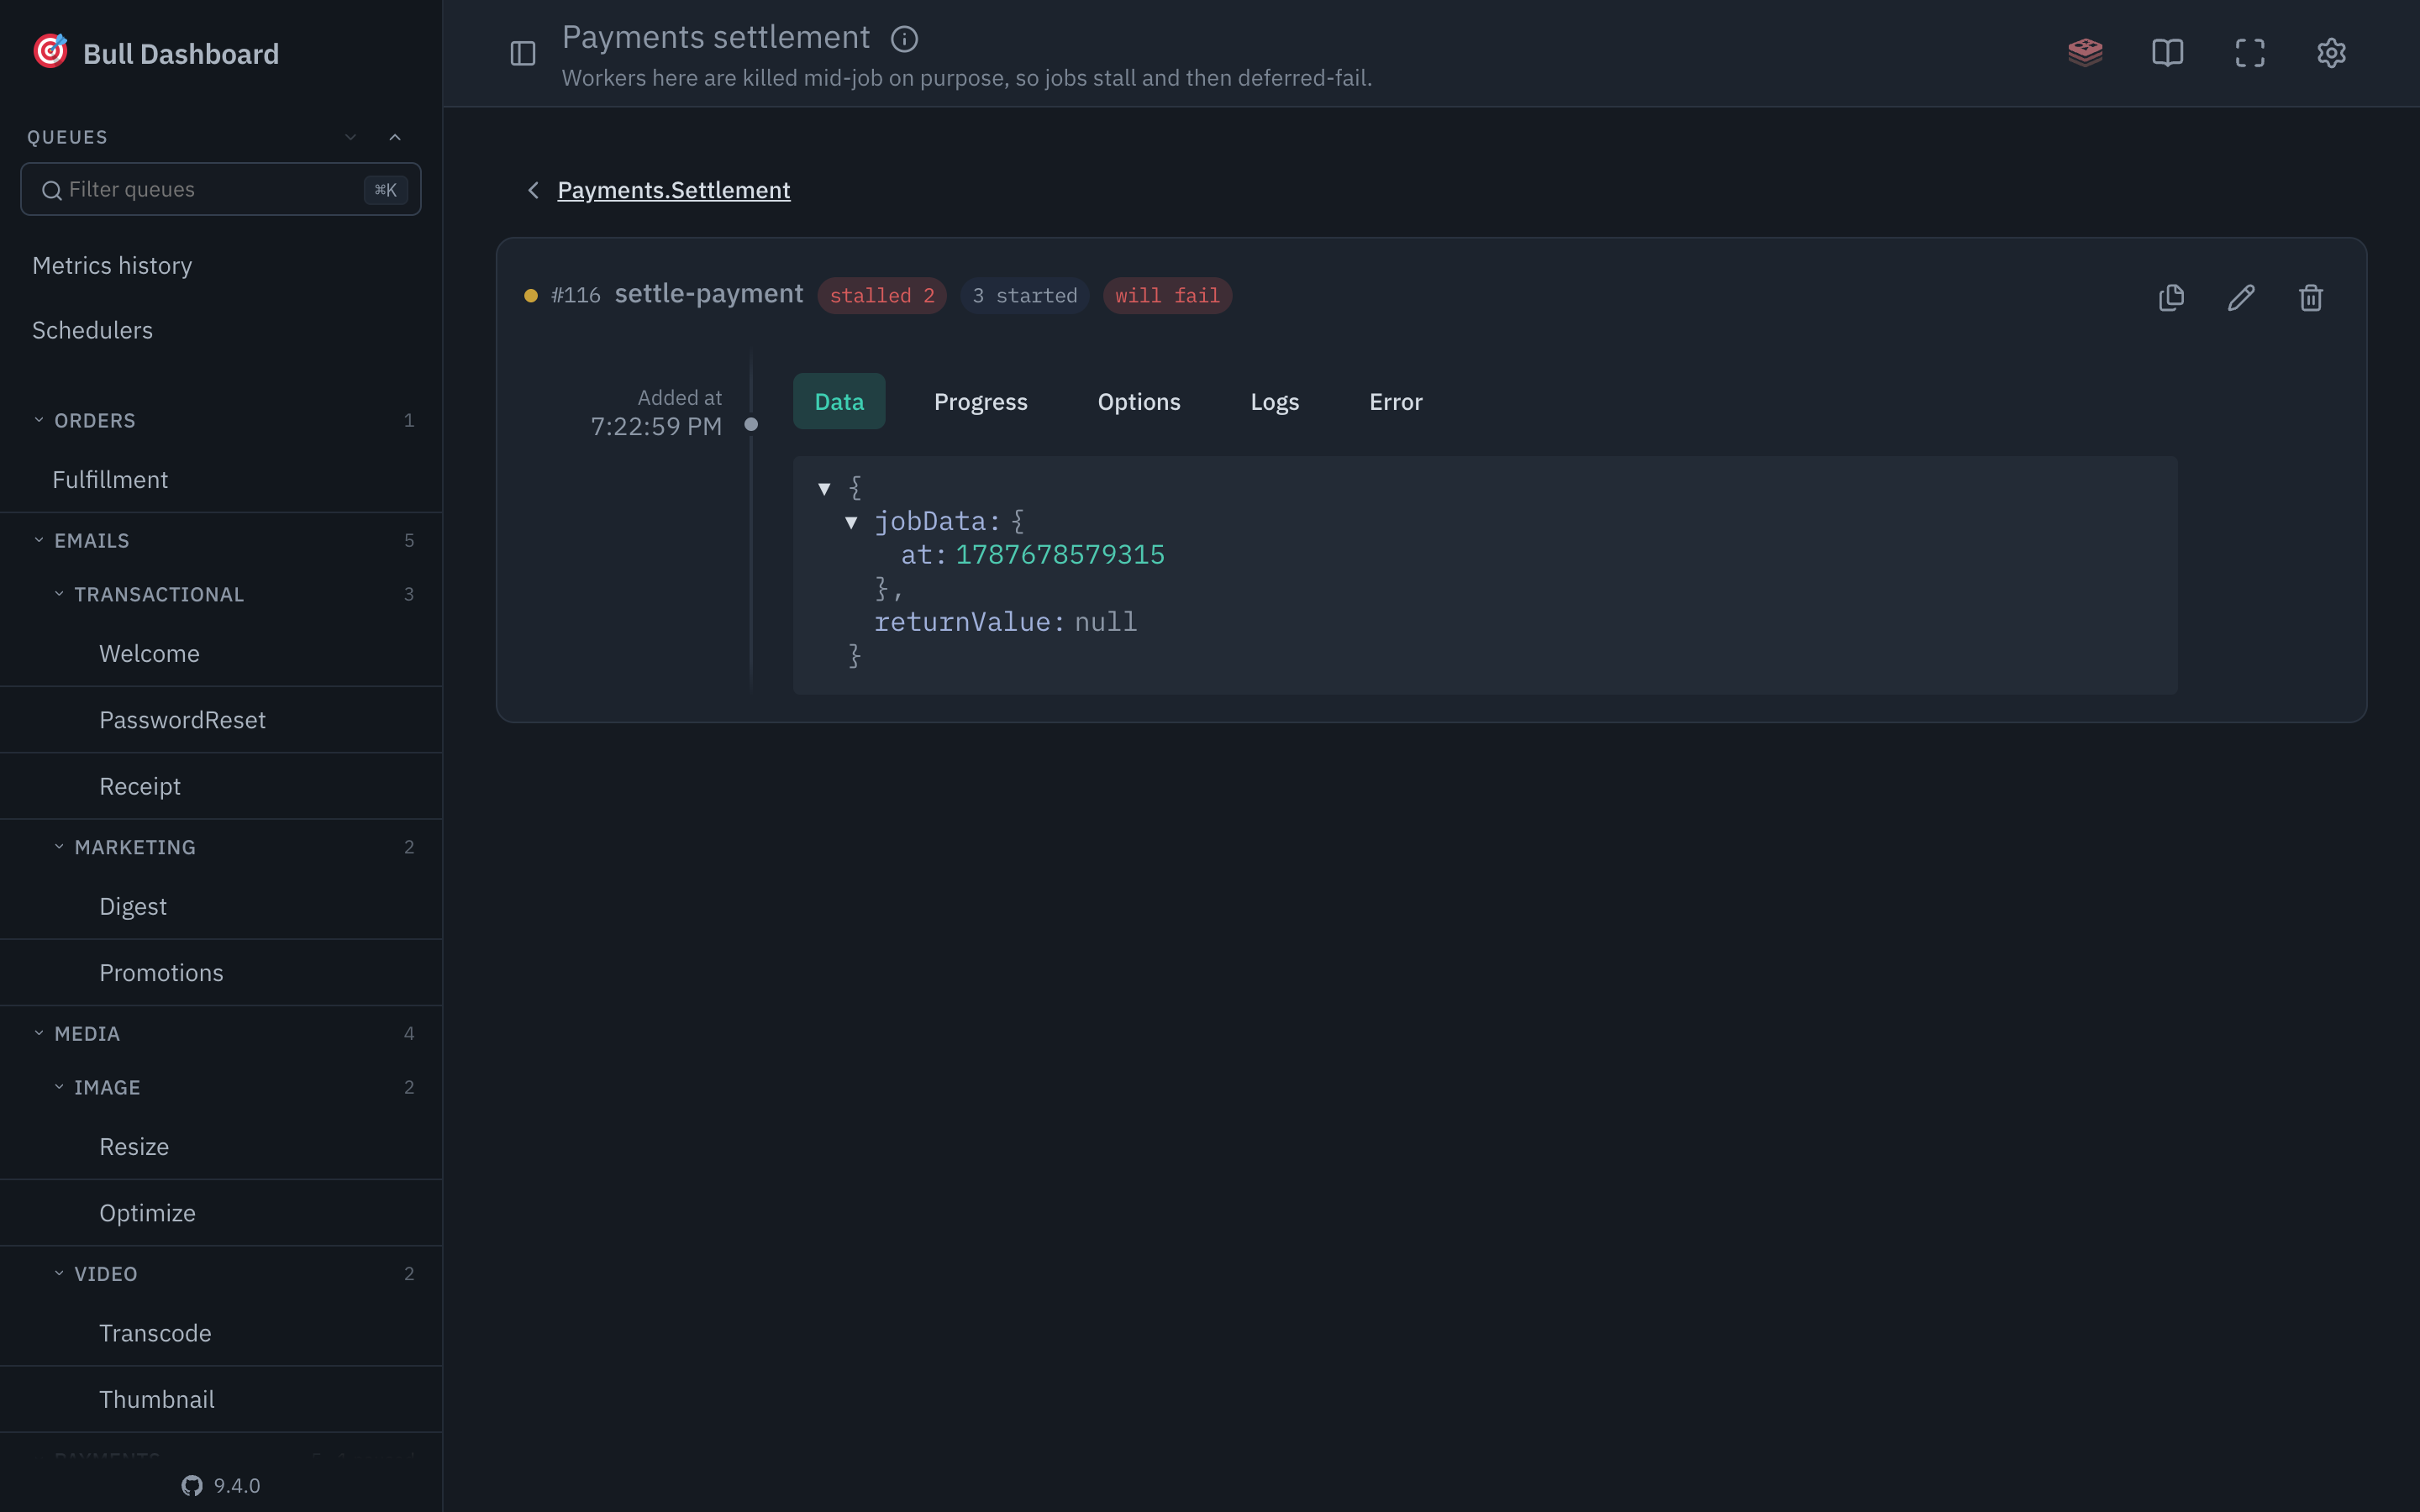
A job sitting in a queue doing nothing looks the same whether it is simply waiting its turn, whether a worker keeps picking it up and losing it, or whether BullMQ has already decided it is going to fail. The board carries five facts off each job that tell those apart, shown as pills beside the job name and only when there is something to say.
stalled N counts the times a worker took the job and never finished, which happens when a worker is killed mid-job or blocks long enough for its lock to expire. Beside it, N started is how many times the job was picked up, so a job on its first attempt that has already started twice is one that stalled and came back.
will fail marks a job BullMQ has condemned: it has stalled past maxStalledCount and is waiting in the queue only until a worker takes it and fails it immediately. Its reason fills the Error tab, which otherwise says a job about to be nothing but an error has no errors.
dedup <id> names the deduplication key a job was added under, which is what explains a job you expected to see and cannot find: it was added, matched a live key, and dropped. The full id is in the tooltip when it is too long for the pill.
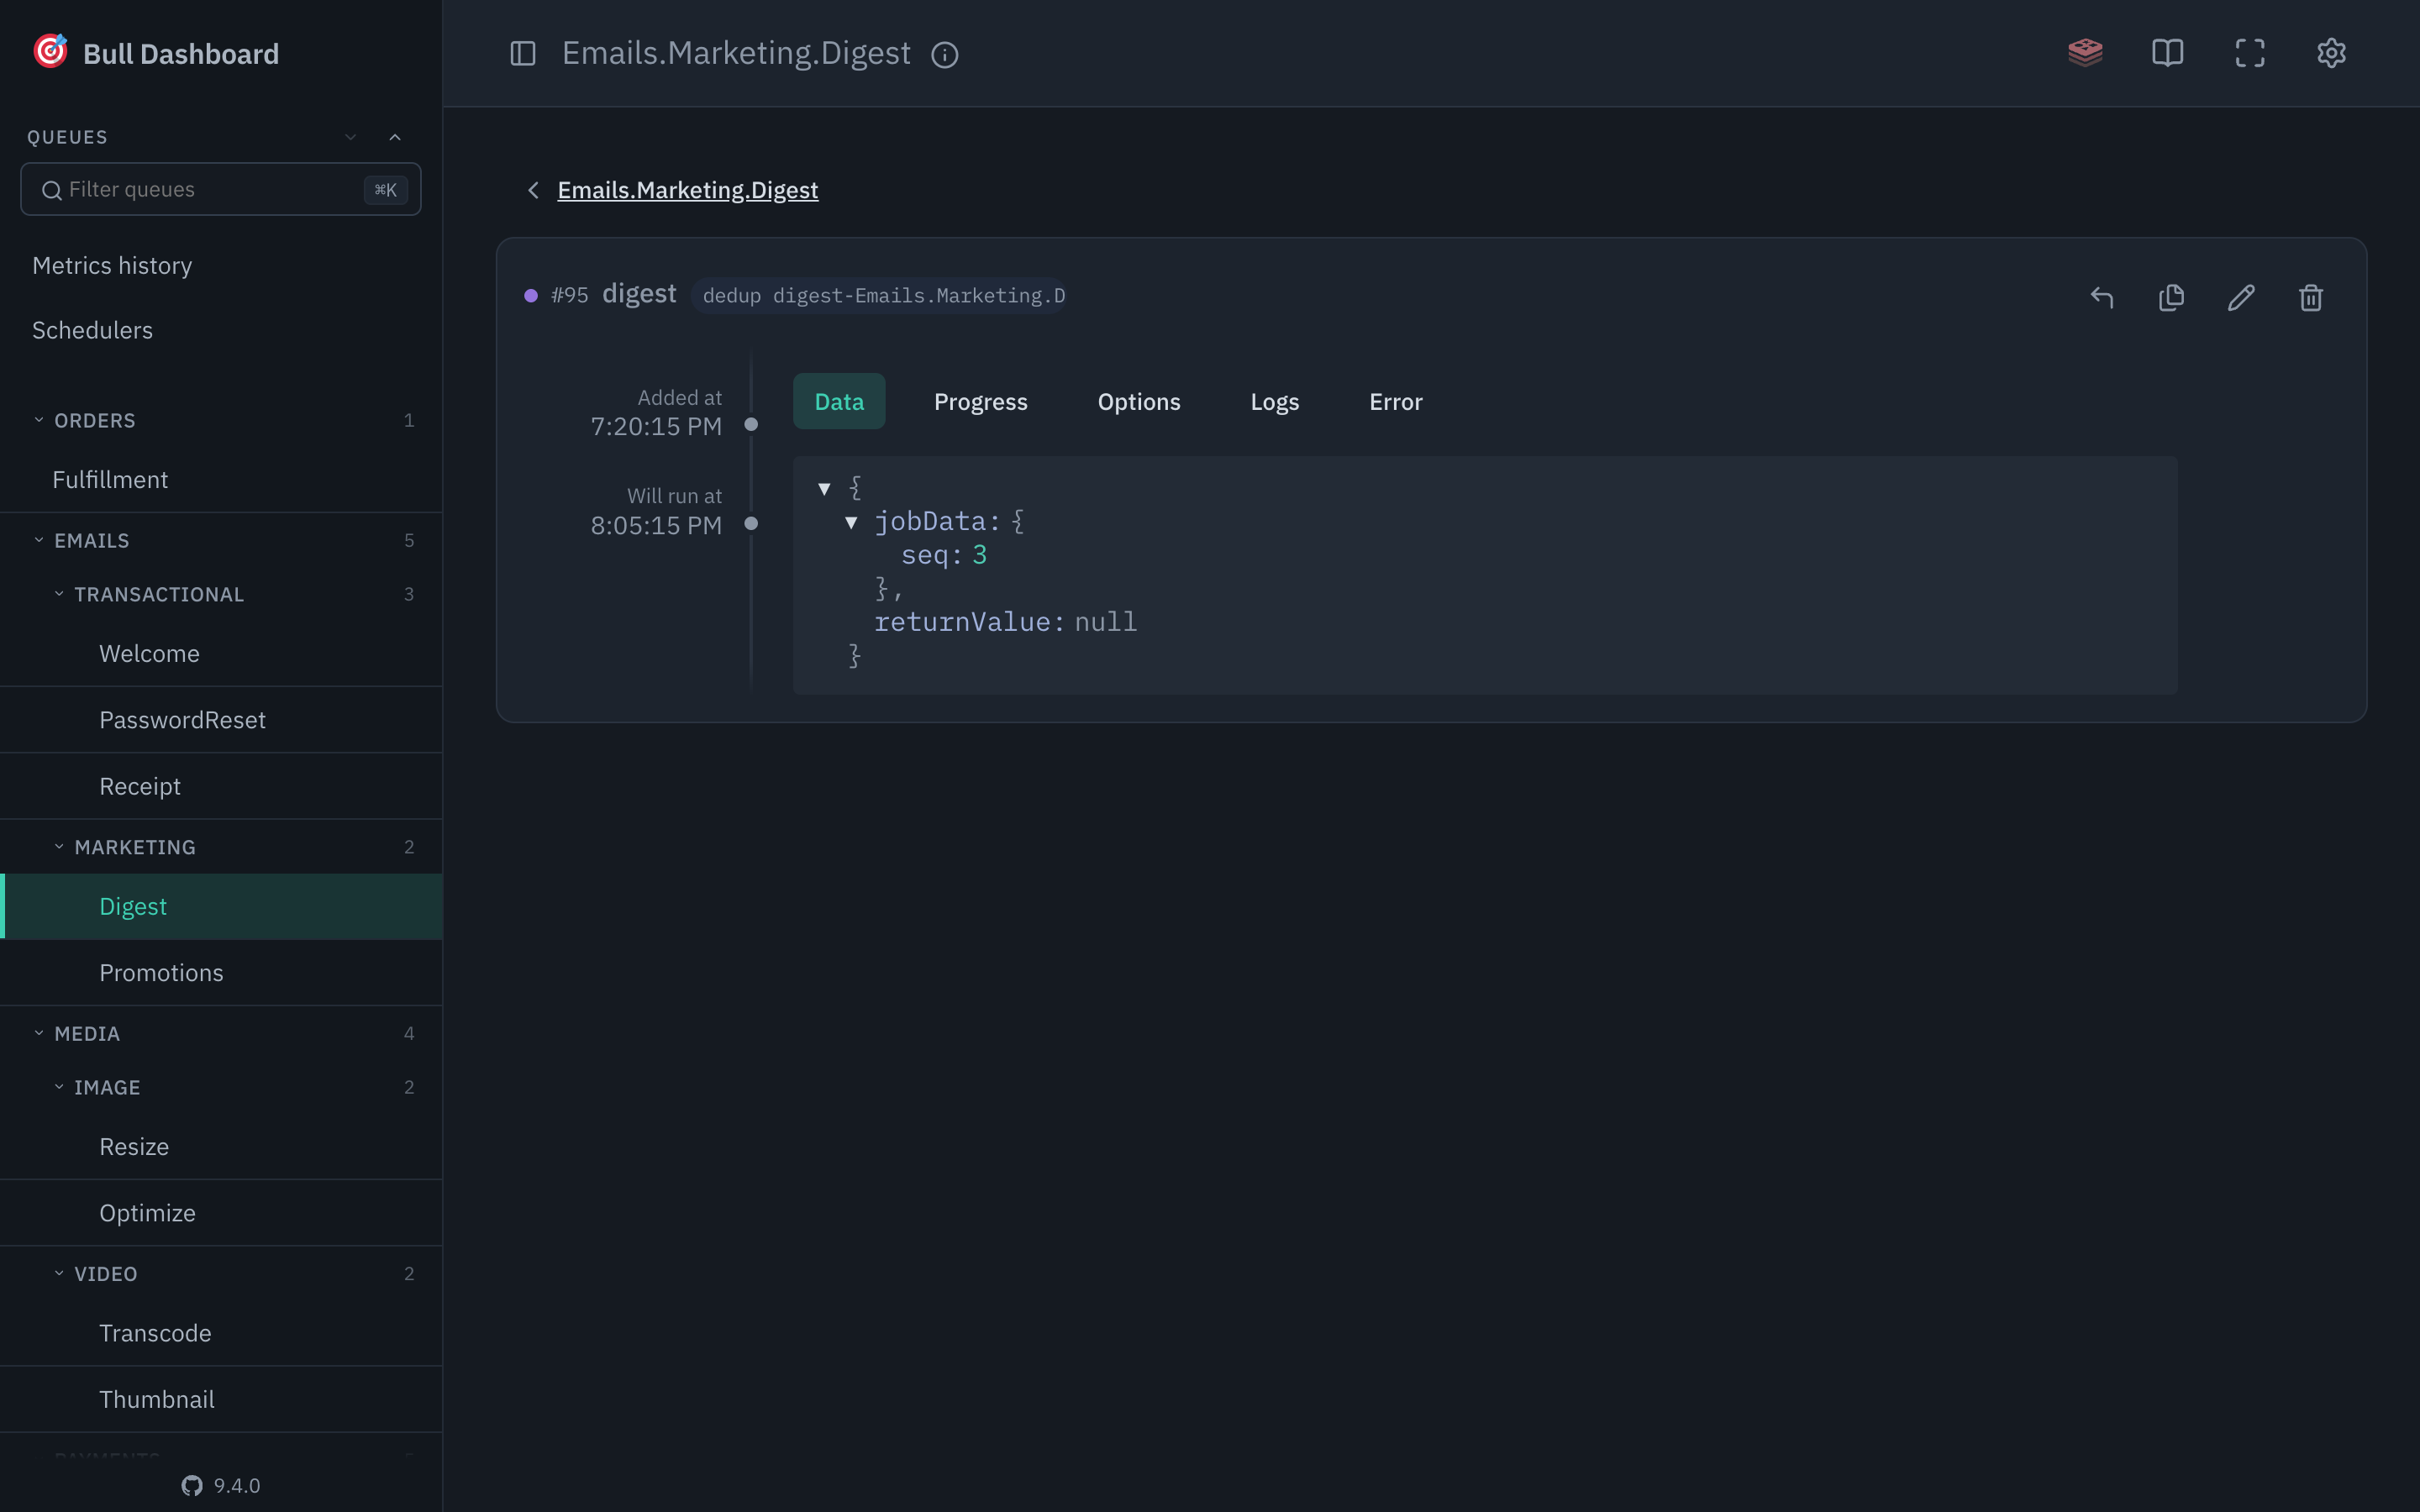
priority N shows what the prioritized tab is actually ordering by, which was previously only readable from the raw options JSON.
None of these appear on Bull queues, which report none of them, and none appear on a healthy job. The only thing the board spends space on is the case worth acting on, the same way the no-workers badge does.
Rescheduling and reprioritising a job
A delayed job's card shows when it will run, and until now the only two things you could do about that were promote it, which runs it immediately, or delete it. Neither is what you want when a nightly export needs to move two hours later because the upstream feed is late.
Delayed jobs now carry a Reschedule action beside Promote. It opens with the job's current run time filled in, and picking a new one calls Job#changeDelay with the difference. A time in the past is not an error: it resolves to a delay of zero, so the job runs as soon as a worker is free, which is the same outcome as promoting it.
Prioritized jobs get the matching Change priority action, which calls Job#changePriority. Lower numbers run first, 0 removes the priority, and the ceiling is 2097151, which is BullMQ's own limit and the point past which its ordering stops being reliable.
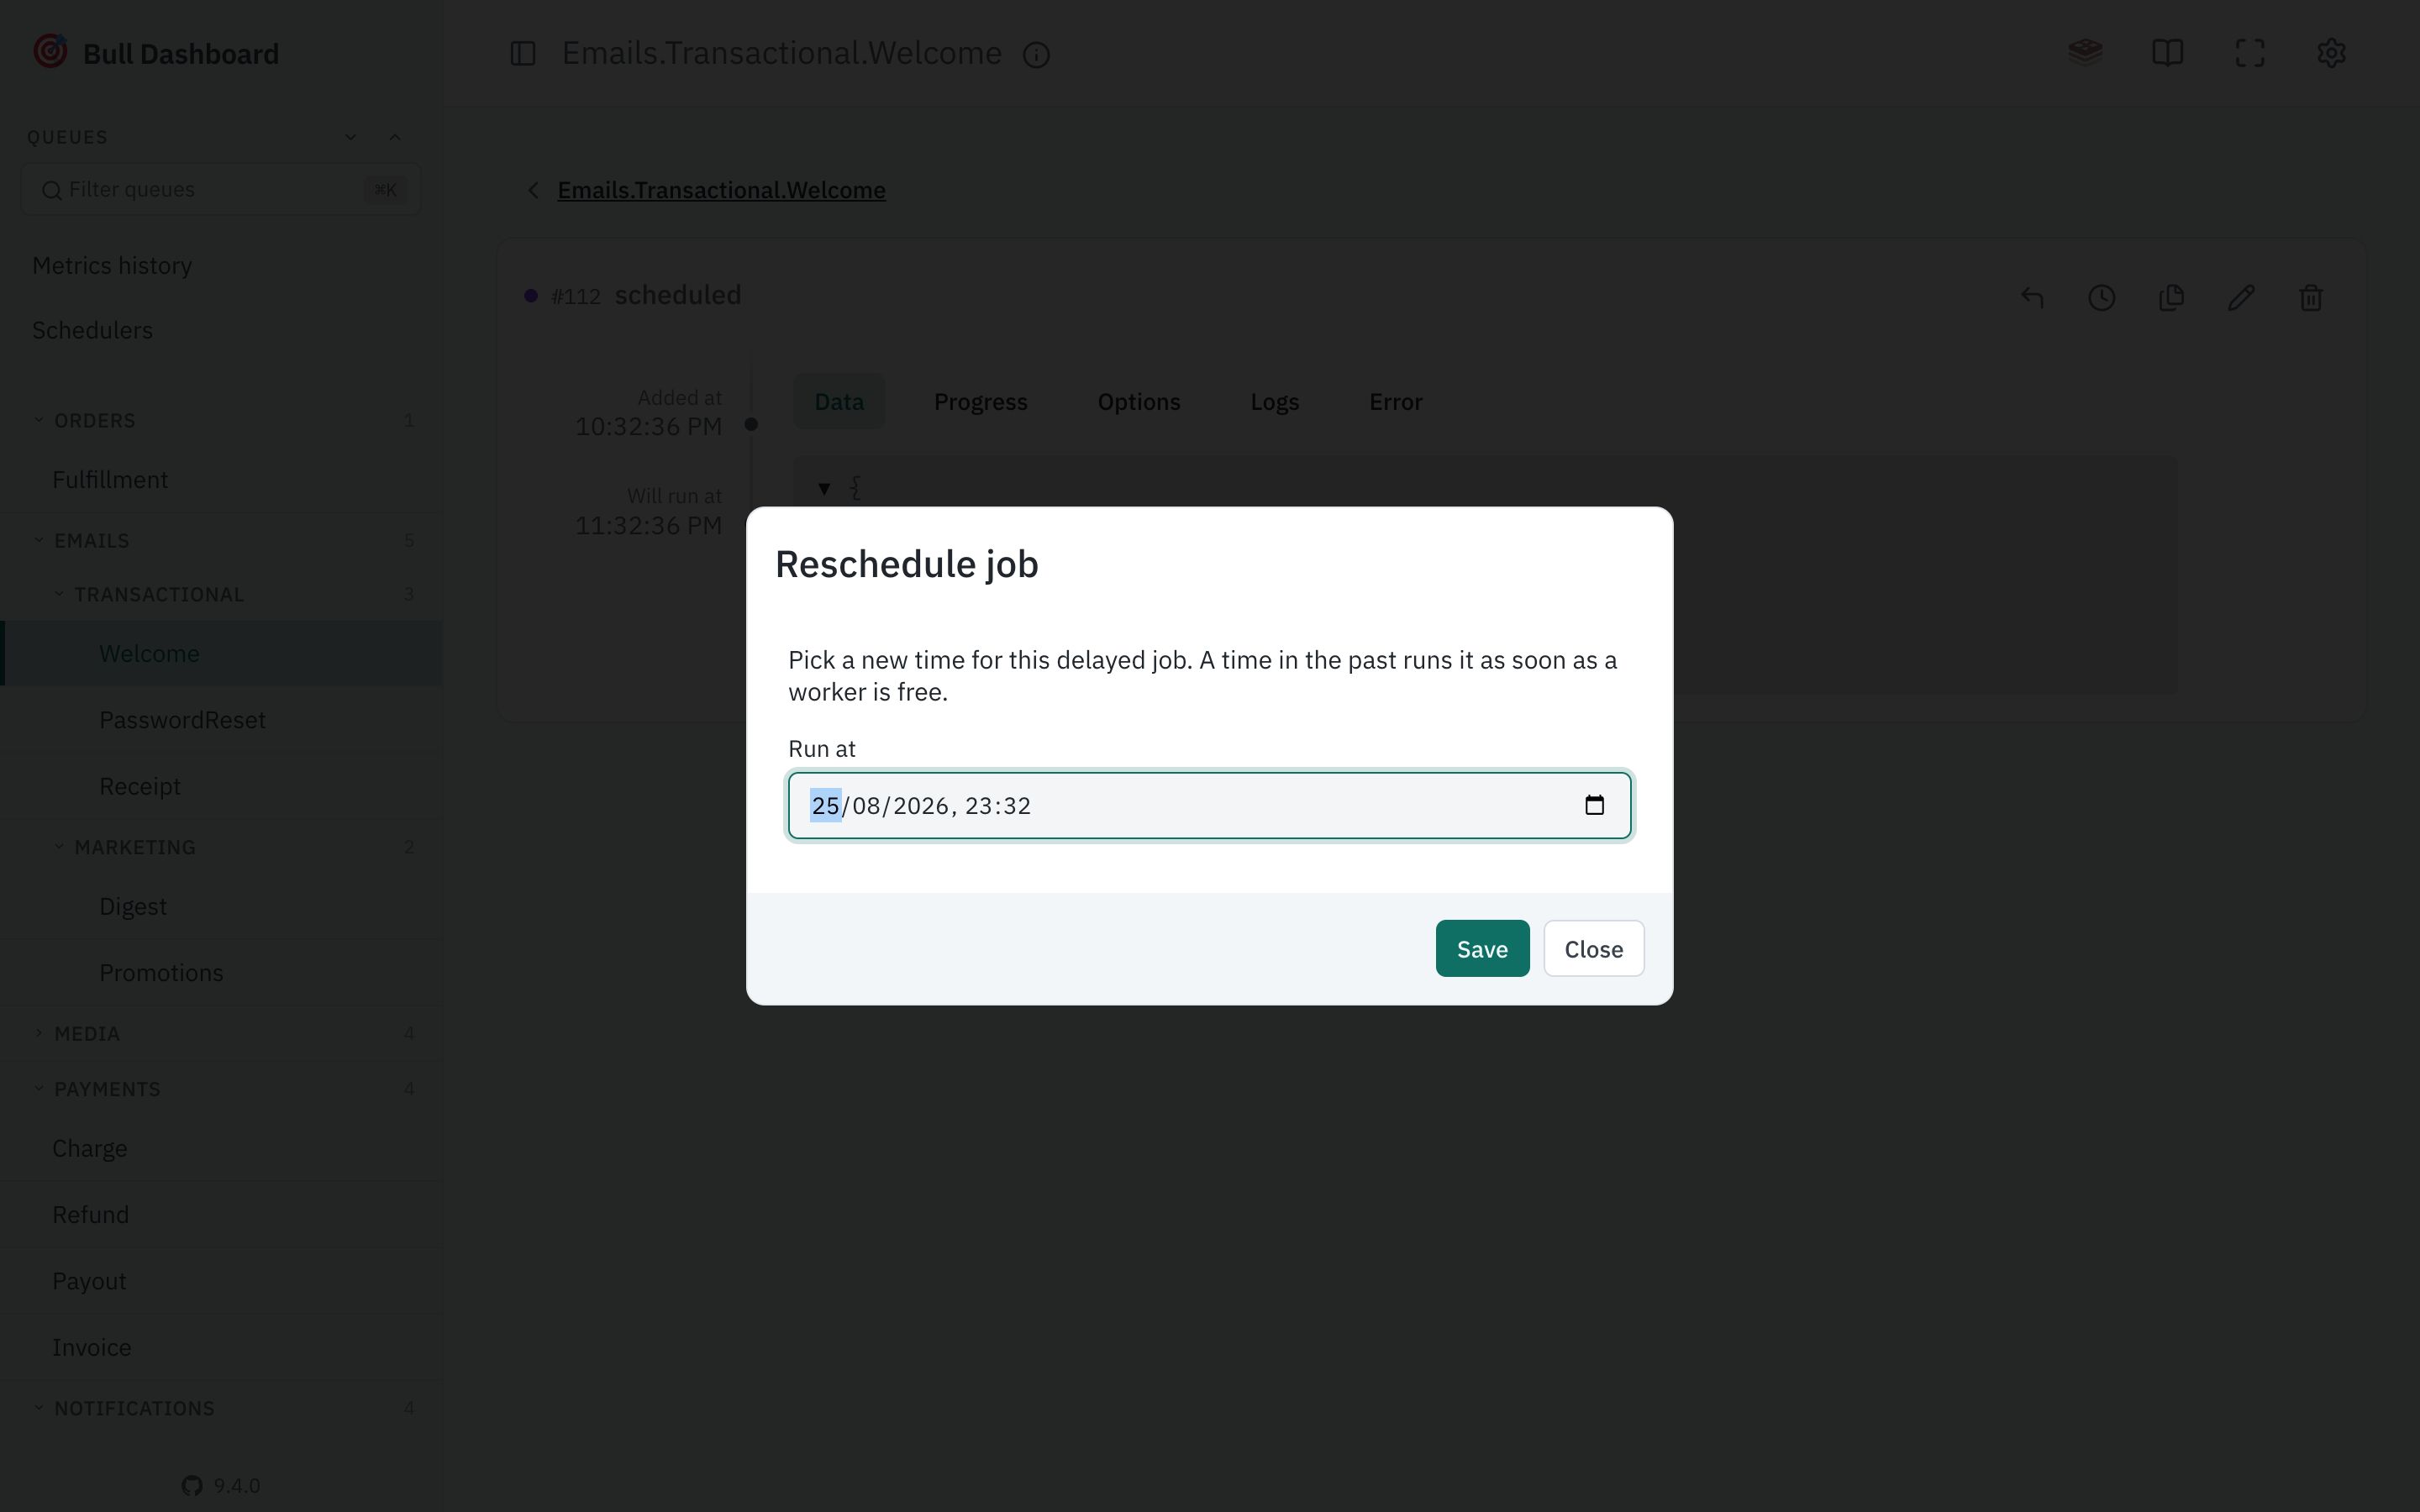
Both respect readOnlyMode, and both are BullMQ-only. Bull can neither change a delay nor a priority after a job is added, so the actions never appear on a Bull queue and the endpoints answer 400 if something calls them anyway.
Like the schedulers view, these are operational changes rather than configuration. Rescheduling a job moves that one run; it does not change what your application will add next time.
Settings
The gear in the header opens per-browser preferences, split into General, Queues and Jobs. Polling interval, language and dark mode live in the first; grouping and sort order in the second; which job tab opens by default, how deep JSON starts collapsed and how many jobs a page shows in the third. Everything is stored in your own browser, so nothing here changes what anyone else sees.
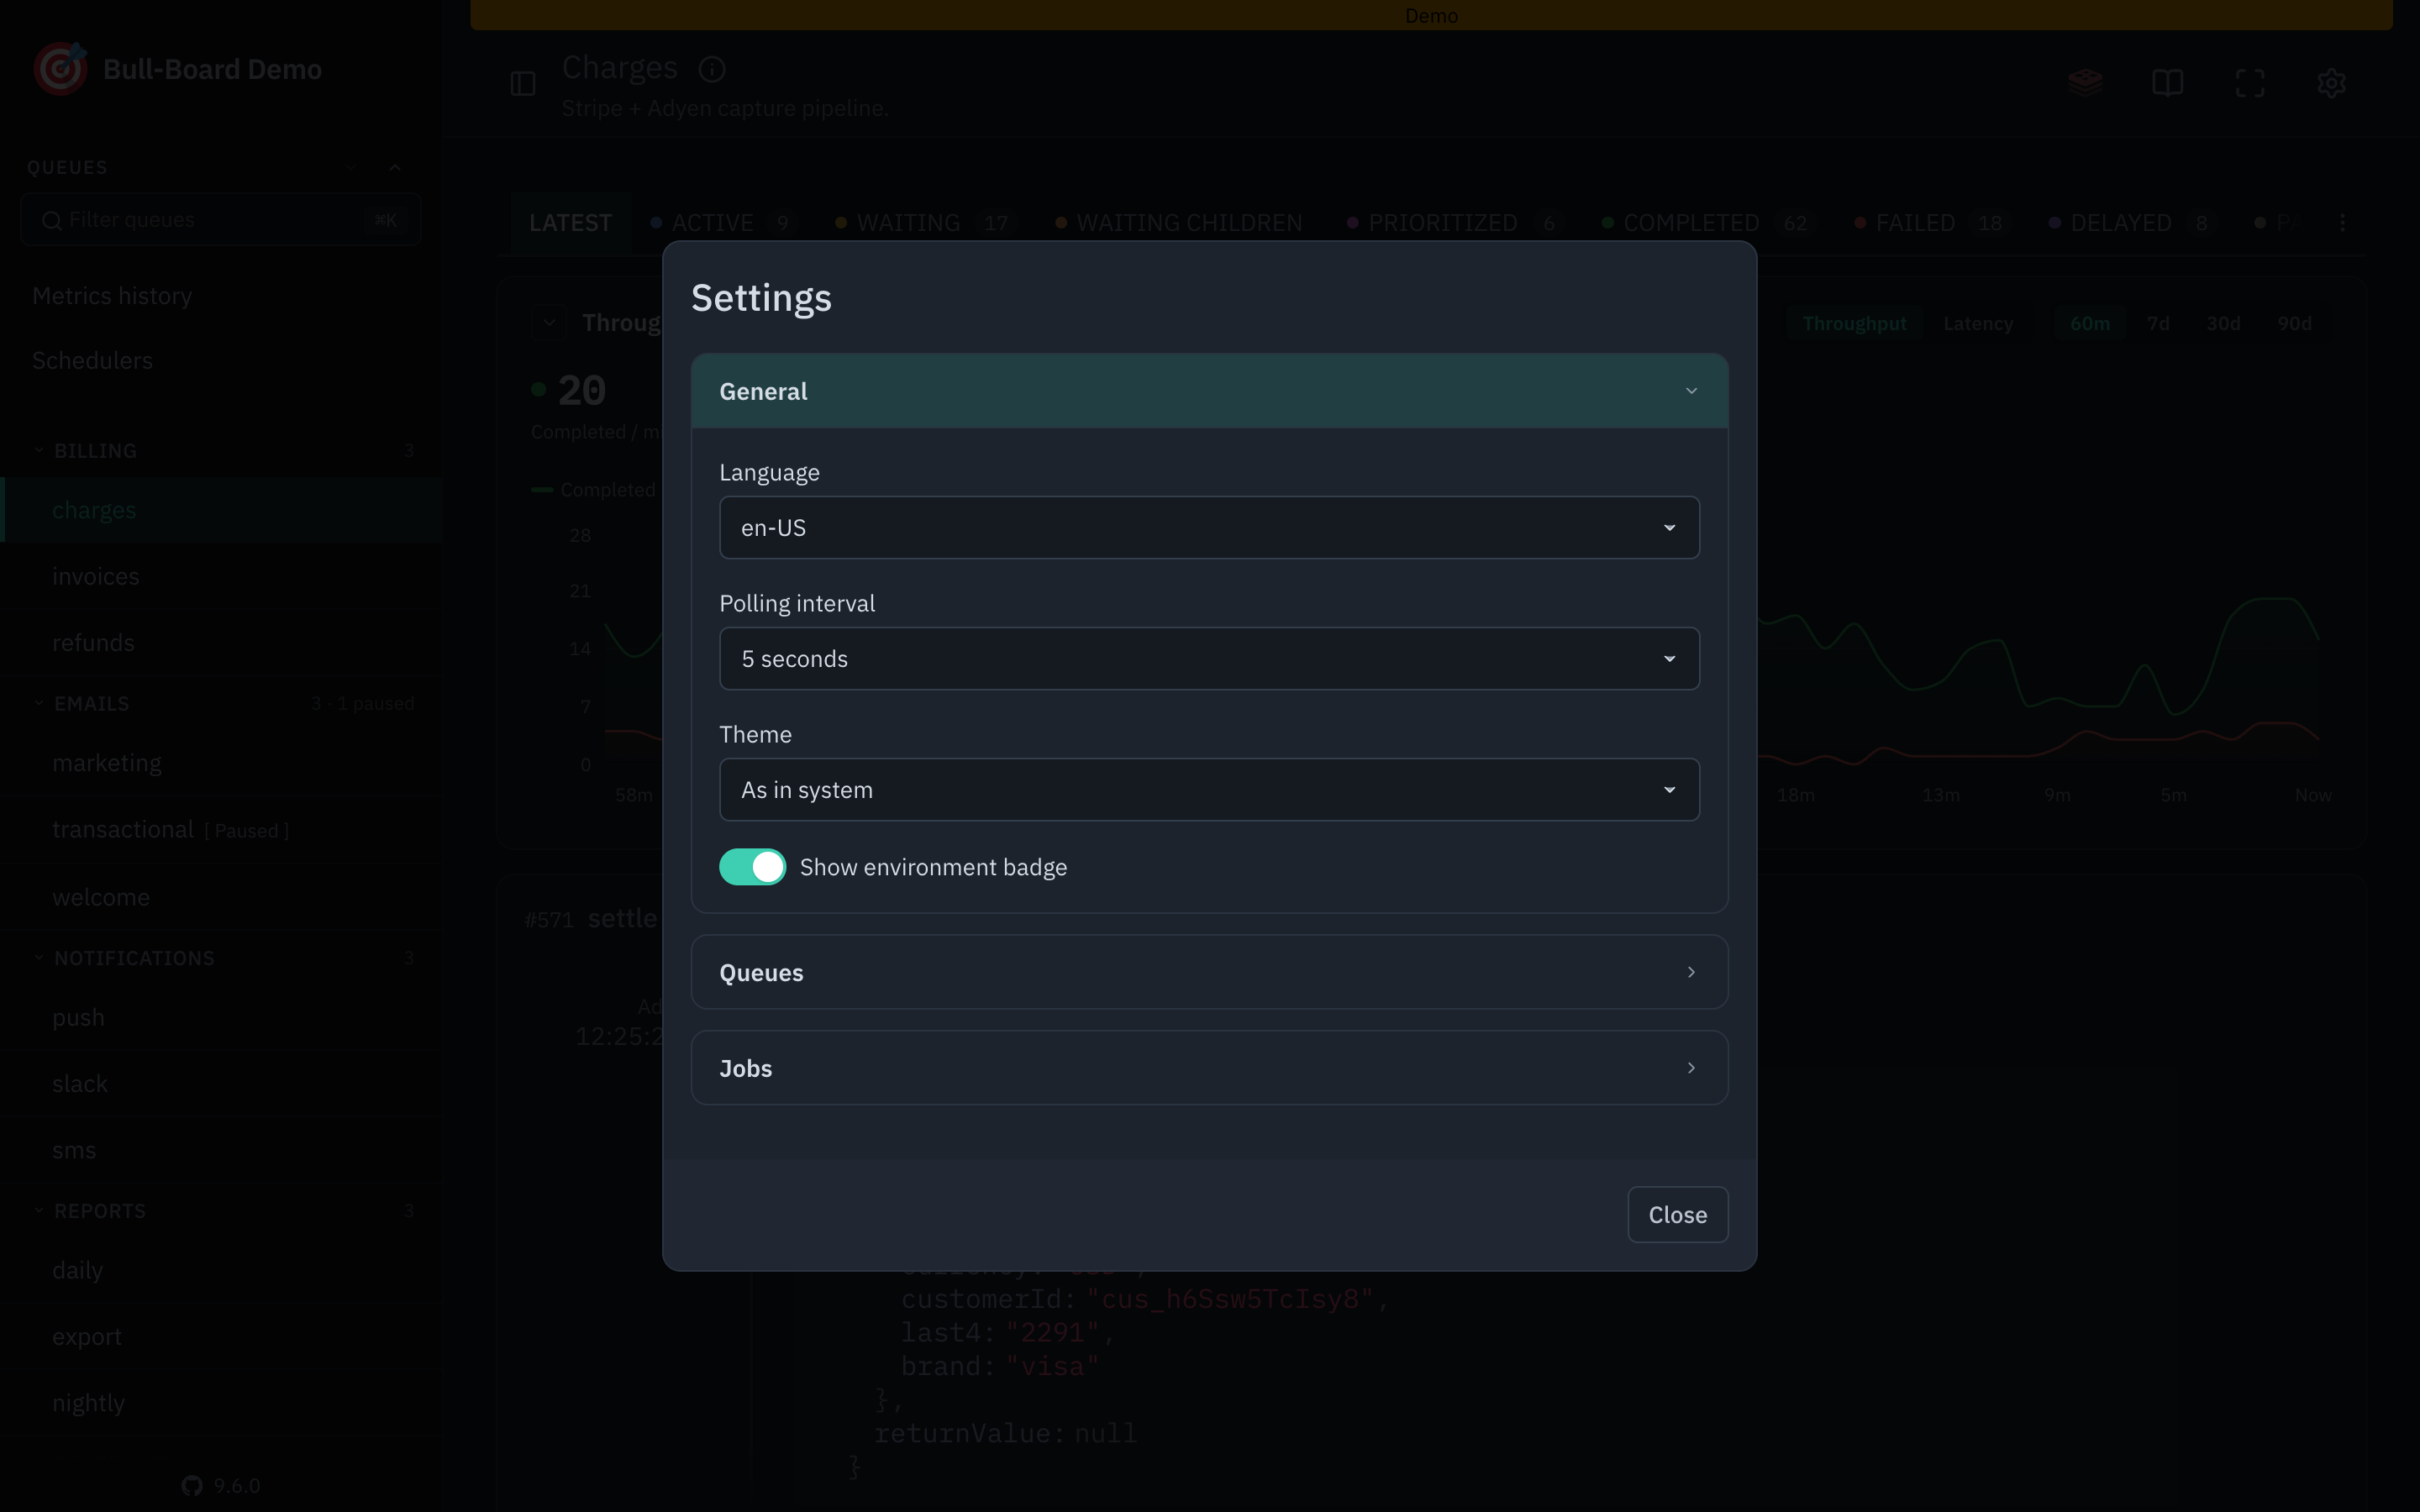
Some of these can be fixed or hidden for everyone from UIConfig, which is how you stop people picking a two second polling interval against a large Redis.
On a phone
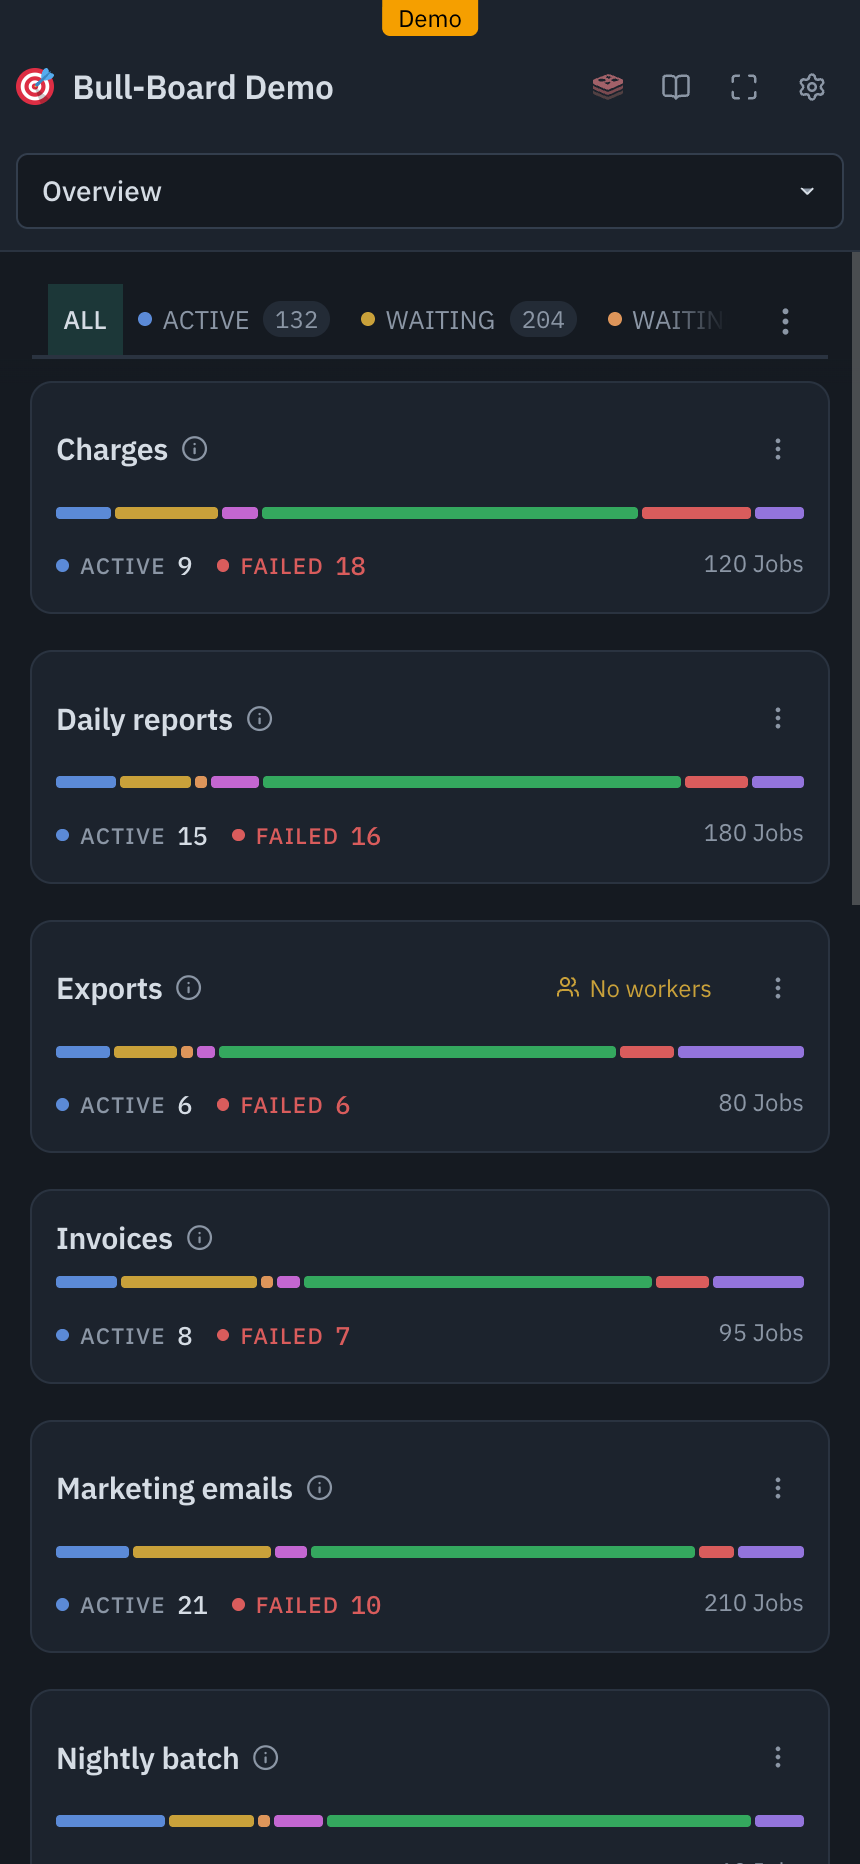
Below 768px the sidebar becomes a dropdown in the header and the cards go to one column. The status filters stay scrollable rather than wrapping, so the counts you act on are still one tap away.
Connected workers
A queue with a growing waiting count looks the same whether it is simply busy or whether every worker consuming it has died. The dashboard tells the two apart.
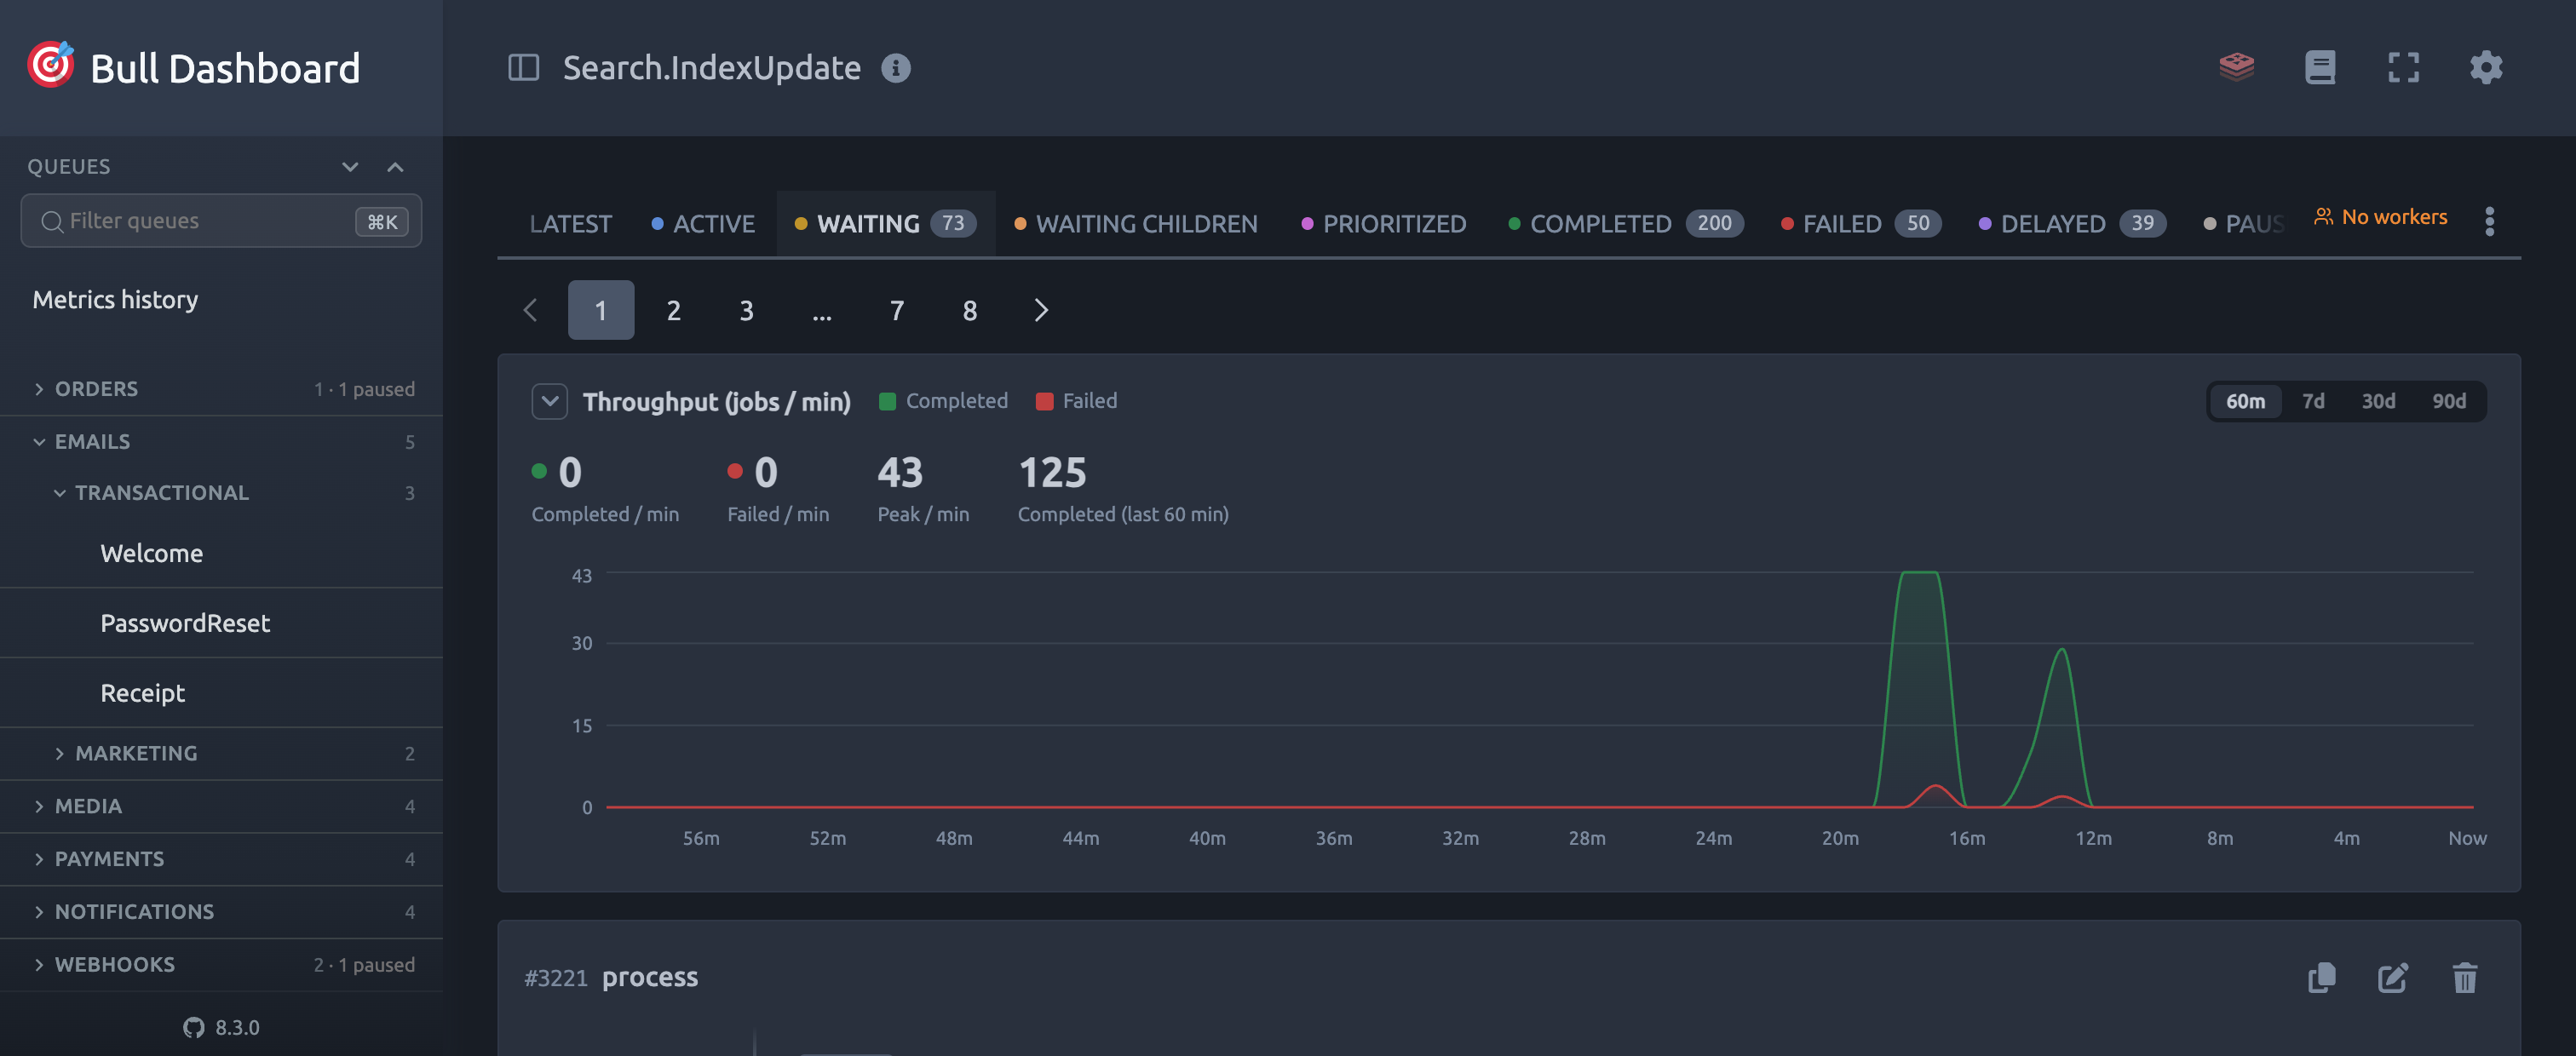
Nothing appears while a queue is healthy. A badge shows up only once a queue has no workers connected and is not paused, on its overview card and beside the status tabs on its own page, so the only thing the dashboard ever spends room on is the case worth acting on. A paused queue is meant to have nothing consuming it, so it never warns.
On the queue page it sits with the status tabs, next to the backlog it explains.
Who is actually connected lives in the queue info panel, under Connected workers, with the count beside global concurrency in the overview. Open it from the info icon next to the queue name, or by clicking the badge, which drops you straight onto that section.
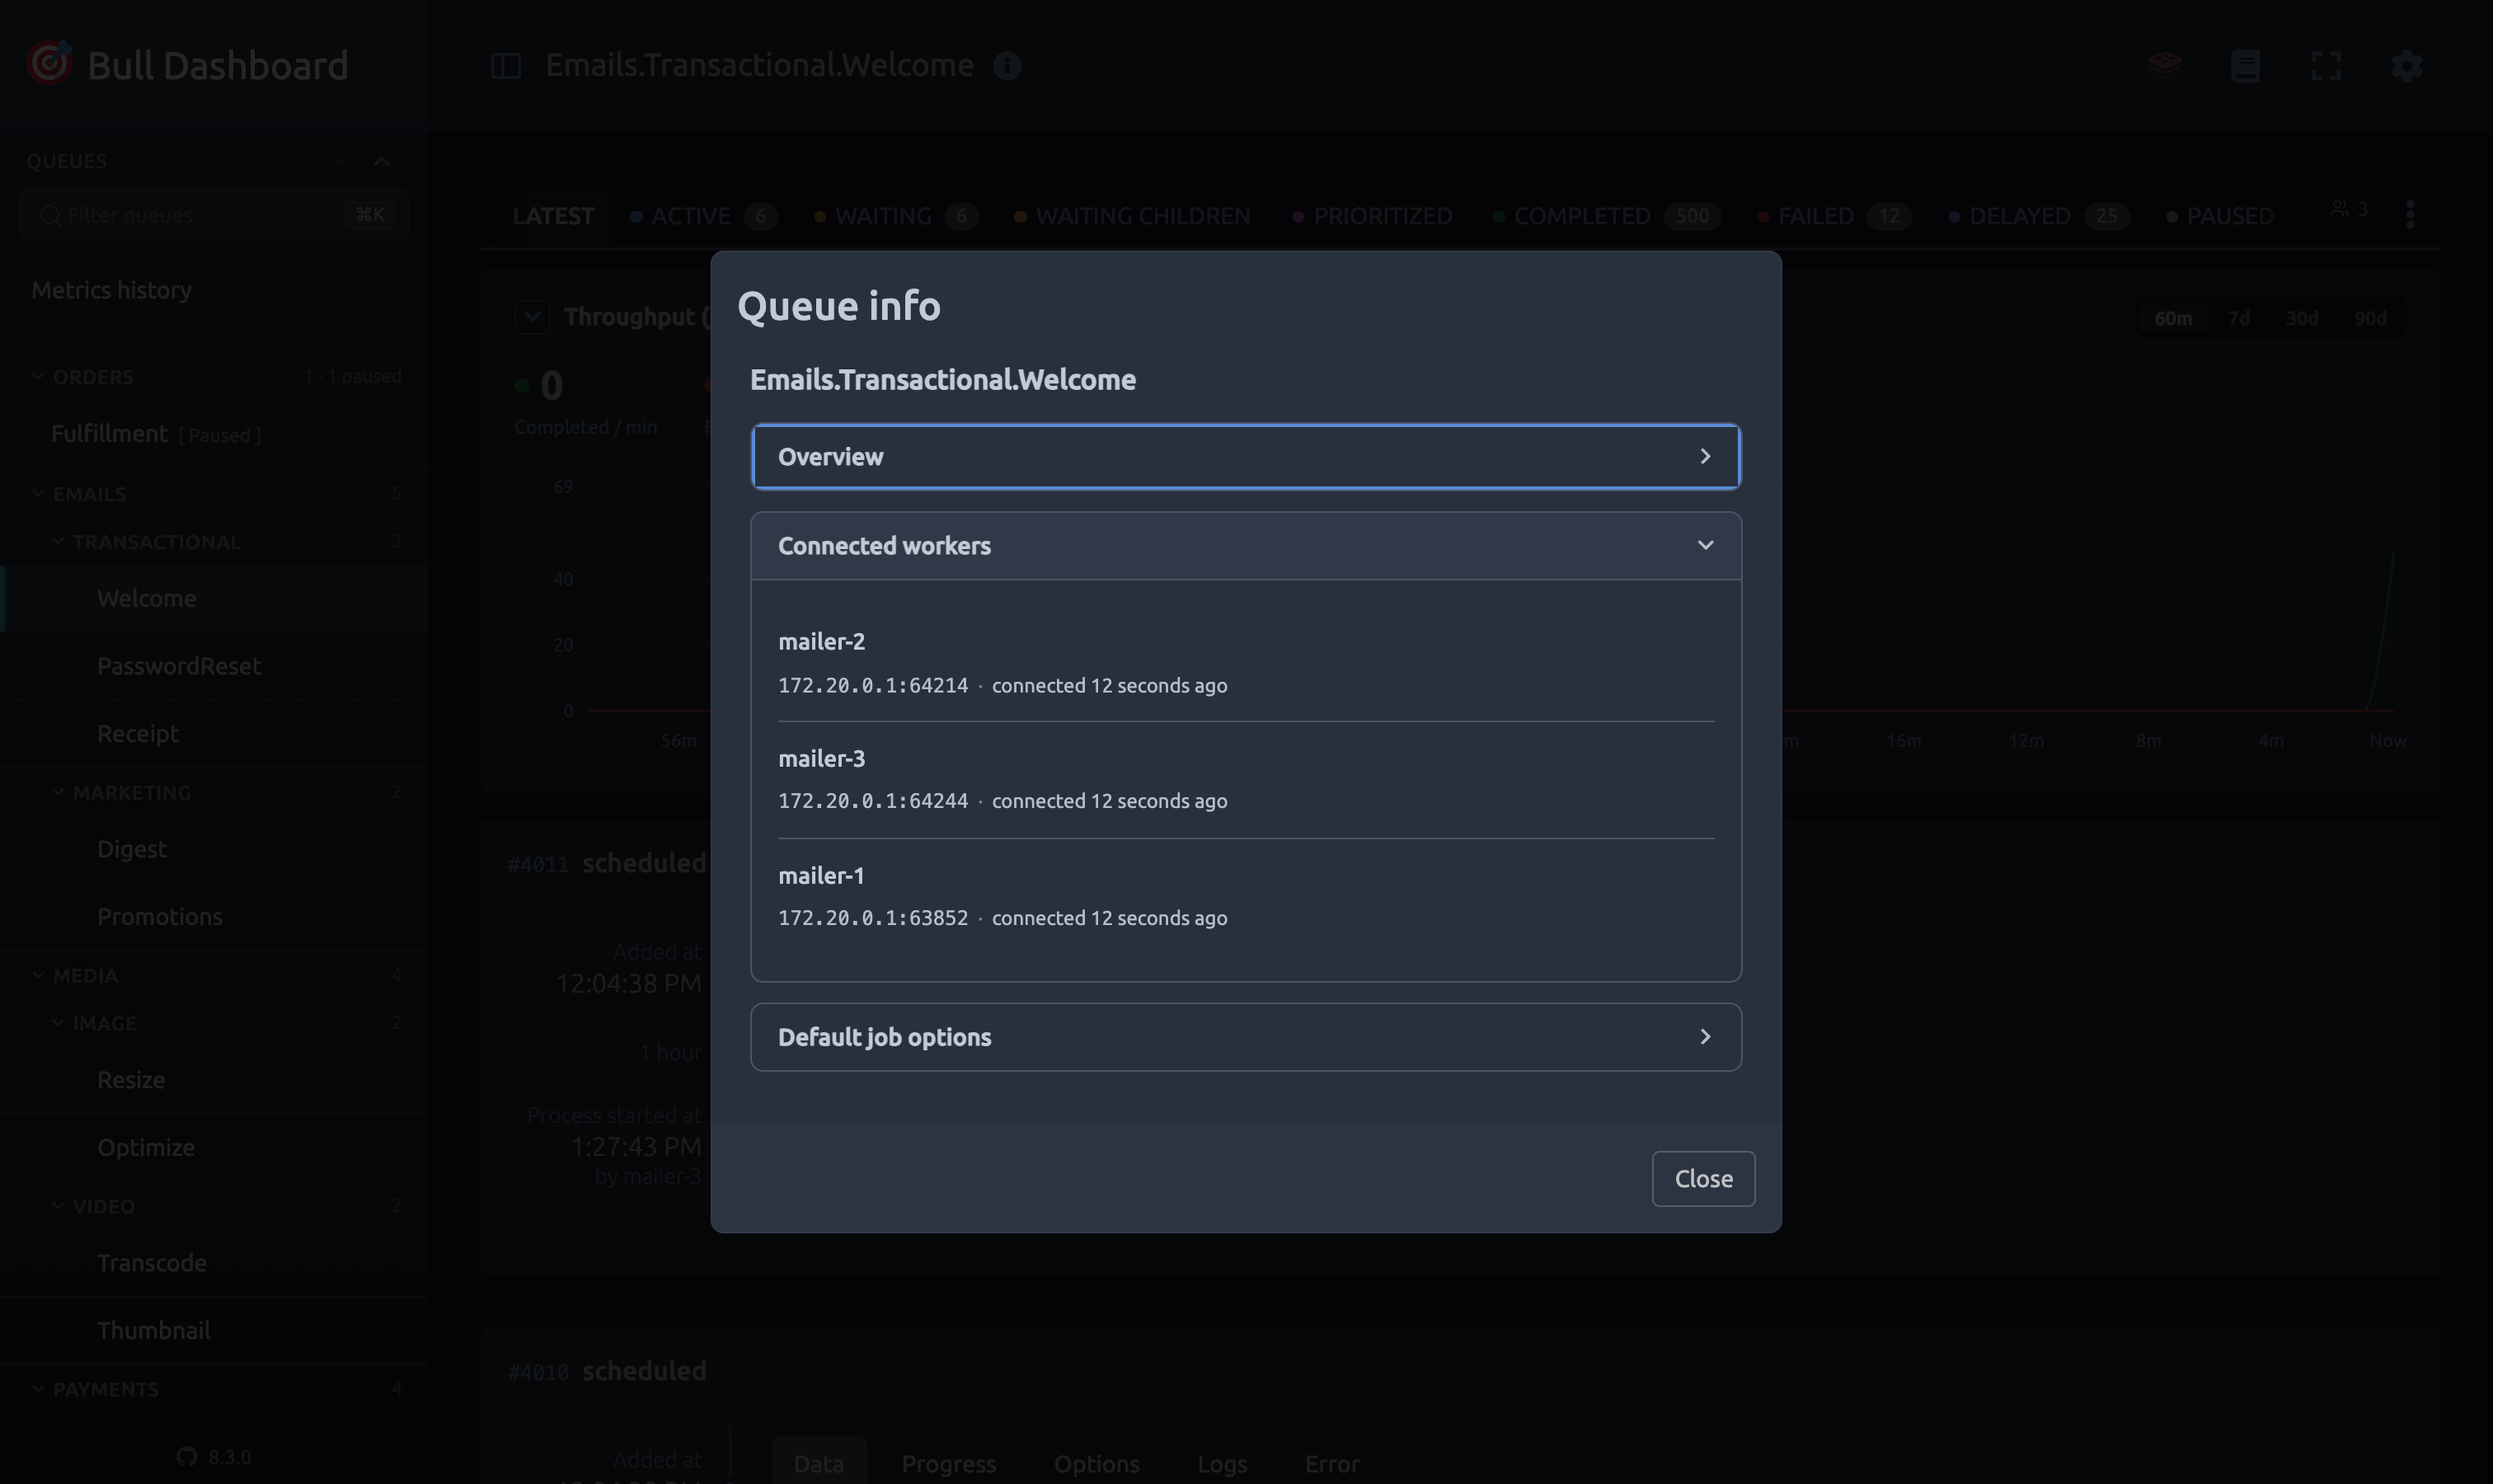
Each worker leads with whatever identifies it, which is the name you gave it (new Worker(queueName, processor, { name: 'mailer-1' })) or its address when you gave it none, and carries the address and how long it has been connected underneath. The badge only exists while something is wrong, so this panel is how you check on a queue that looks fine.
The list comes from Redis CLIENT LIST, which is how both Bull and BullMQ implement getWorkers(). Some hosted Redis providers block that command, Google Memorystore among them. There the dashboard says nothing about workers at all, in the badge or the info panel, rather than reporting a queue as having none.
Whether a queue has workers rides along with the queue listing the dashboard already polls, so the warning costs no request of its own. Who they are is asked for once, when you open the info panel. What it does cost is one CLIENT LIST per queue per poll, which is cheap on a handful of queues and less so on a board with dozens, so it can be switched off wholesale with showWorkers: false in UIConfig. That stops the command being run rather than just hiding the badge.